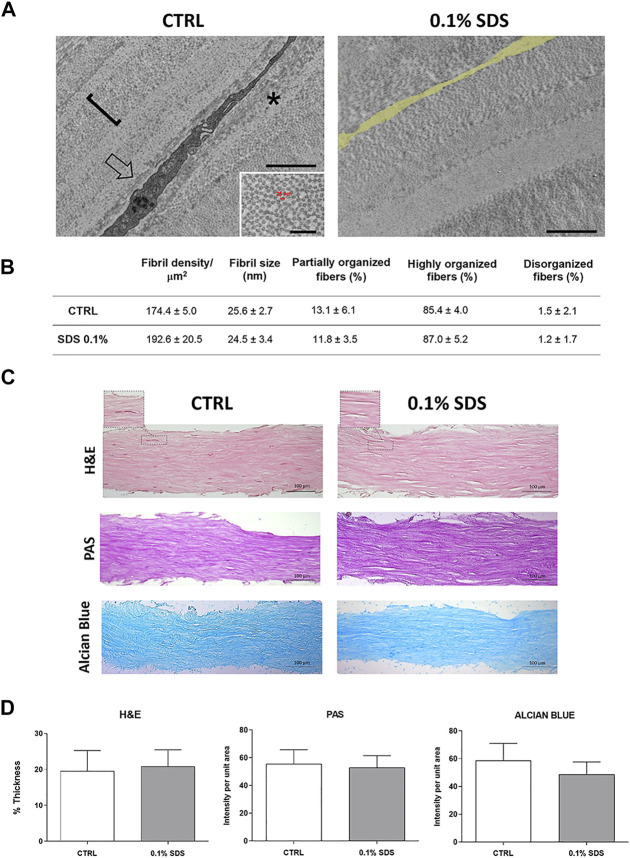
FIGURE 2.
Collagen fibrillar structure and morphology in decellularized lenticules. (A) Representative TEM images of lenticules showing a keratocyte (arrow in the left panel) or empty cell space (false labelled in yellow in the right panel), in control and 0.1% SDS-treated lenticules, respectively. Asterisk marks a partially organized collagen fibers. Scale bar: 2 μm (inset, 500 nm). (B) Morphometric TEM analysis of collagen fibril size (calculated as indicated in the inset of the TEM left panel), density (one fibril is marked with the square bracket in the TEM picture) and organization in control and 0.1% SDS-treated lenticules. Data are presented as mean ± standard deviation (SD). Significance was assessed using a t-test (for fibril density and size) or a chi-square test (for percentages of organized fibers). (C) Representative histochemistry images of control and 0.1% SDS-treated lenticules (20x). Lenticules were stained for H&E (Thickness), PAS (Glycoprotein content) and Alcian Blue (Glycosaminoglycans content) (Scale bar 100 μm). AuthorAnonymous, (D) Histogram shown lenticules thickness (H&E) and the quantification analysis of PAS (glycoproteins) and Alcian Blue (glycosamminoglycans) staining intensity. Data are presented as mean ± standard deviation (SD) and are compared to untreated condition (n = 6).

