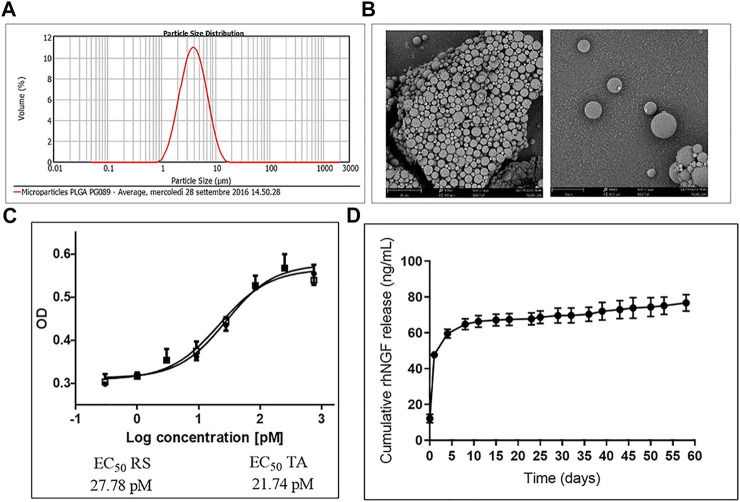
FIGURE 4.
Characterization of rhNGF-MPs. (A) Distribution curve showing particles size of rhNGF-MPs between 2 and 6.8 µm, d (0.5) = 3.6 µm, obtained using Mastersizer 2000 (Malvern). (B) Example image of dried microparticles obtained using Scanning Electron Microscopy (SEM). The image shows the smooth and spherical shape of MPs coupled with size measurement. (C) Representative potency assay graph (optical density at 490 vs. Log concentration in PM). The test confirms the biological activity preservation of rhNGF extracted from MPs (TA, empty square) compared to a reference standard (RS, filled circle). (D) In vitro release kinetic. The graph shows the release profile (cumulative) of rhNGF from MPs from t0 to 60 days.

