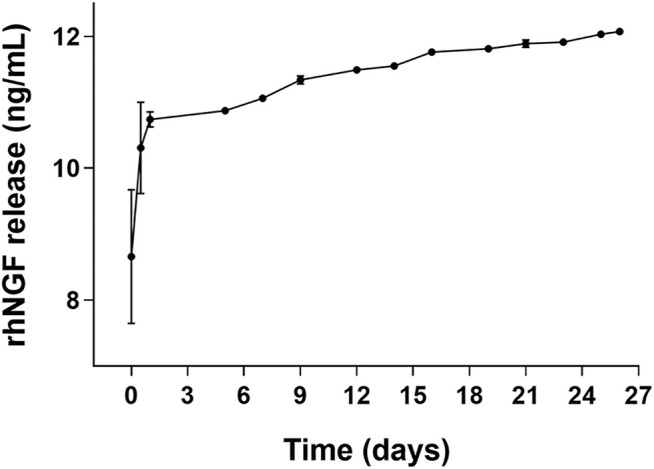
FIGURE 6.

In vitro release kinetic of rhNGF-MPs-loaded lenticules. The graph shows the cumulative release of rhNGF from the MPs previously loaded to decellularized lenticule. Samples are collected every 2 or 3 days and the experiment was maintained for 25 days. Data are reported as mean ± SD (n = 4).
