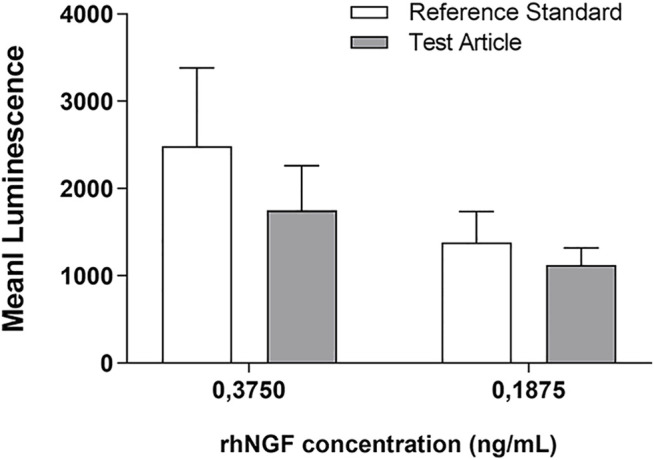
FIGURE 7.

rhNGF activity test using PC12-Luci cell line. The graph shows the luminescence emission of active rhNGF released from the engineered lenticules (Test Article, grey bar) compared with rhNGF reference standard (white bar). The rhNGF reference standard tested was used at 2 different concentrations (0,3750 and 0,1875 ng/ml). Data are reported as mean ± SD (n = 3). (Mann-Whitney U test; p > 0.05, not significant).
