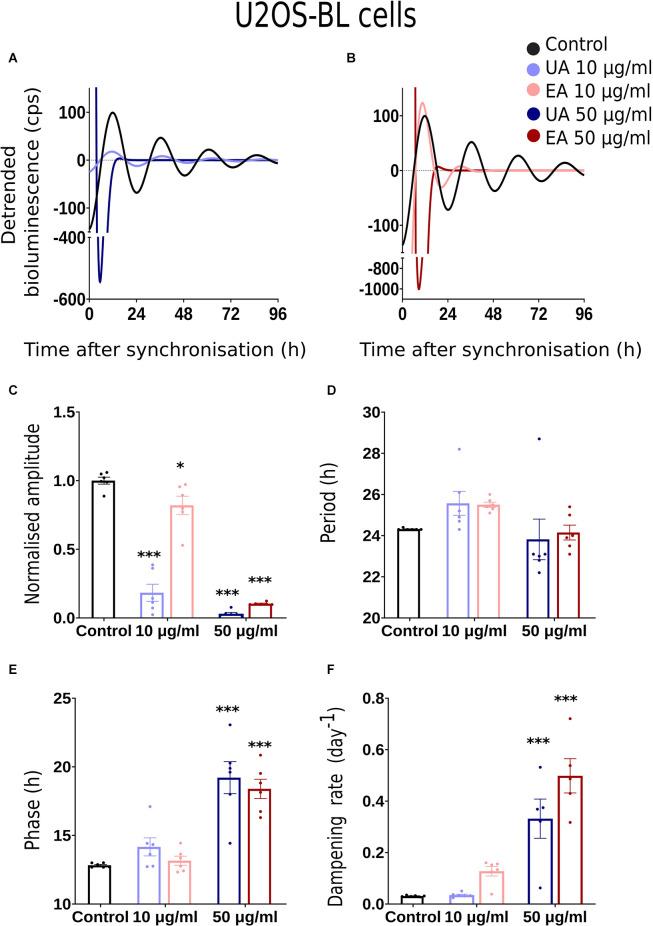
Figure 3.
Effects of lichenized secondary metabolites on circadian luminescence rhythms of U2OS-BL cells. Representative curve fits of Bmal1:luc luminescence rhythms in U2OS cells after treatment with different doses of usnic acid (A, UA/Blue) or evernic acid (B, EA/Red). Amplitude (C), Period (D), Phase (E), and Dampening effects (F) on bioluminescence rhythms in U2OS cells after treatment with EA (10 or 50 μg/ml; red) or UA (10 or 50 μg/ml; blue) vs. solvent control (PBS/ DMSO; black). Single measures are shown; error bars indicate means ± SEM (*p < 0.05, ***p < 0.001; 2-way ANOVA with Tukey’s post-test).

