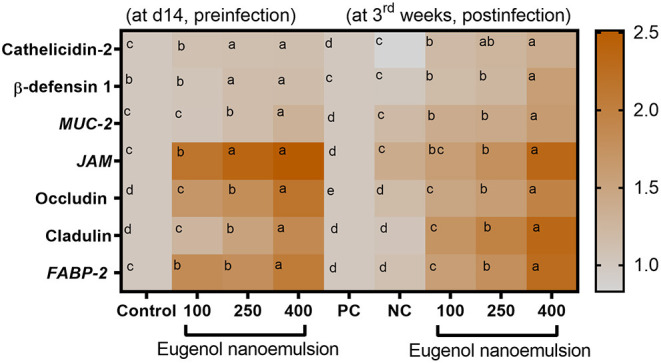
Figure 3.

Heat map illustrating the gene expression profiles associated with barrier functions; cathelicidins-2, β-defensin-1, MUC-2 (mucin-2), JAM-2 (junctional adhesion molecule-2), occludin, CLDN-1 (claudins-1), and FABP-2 (fatty acid binding protein-2) in the jejunal tissues of broiler chickens supplemented with different levels of eugenol nanoemulsion pre- (at day 14) and post- (at 3rd week) E. coli O78 challenge determined by RT-qPCR assay. Values are means with their SE. The intensity of orange color denotes the degree of upregulation of the investigated genes. NC (negative control): birds fed basal diet without eugenol nanoemulsion and were not challenged, PC (positive control): birds fed a control diet without eugenol nanoemulsion and were challenged, eugenol nanoemulsion 100, 250, and 400: birds fed basal diet supplemented with 100, 250, and 400 mg/kg diet eugenol nanoemulsion. All groups except NC were challenged with E. coli O78 at 14 days of age. Different letters within the same row indicate a statistical significance (P < 0.05).
