
Figure 4.
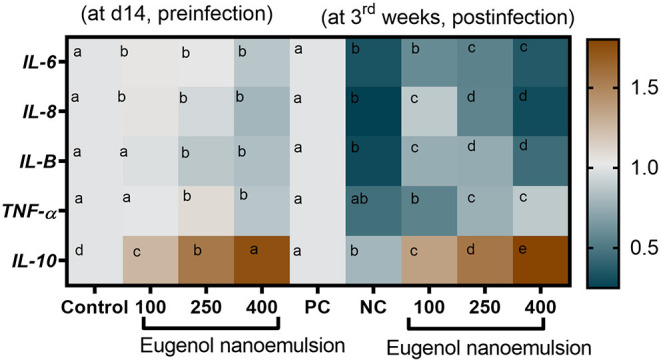
Heat map depicting RT-qPCR analysis of the relative expression levels of mRNAs encoding cytokines; IL-6 (interleukin-6), IL-8, IL-1β, IL-10, and TNF-α (tumor necrosis factor alpha) in the jejunal segments of broiler chickens fed different levels of eugenol nanoemulsion pre- (at day 14) and post- (at 3rd week) E. coli O78 challenge. Values are means with their SE. The intensity of orange and blue colors denotes the degree of upregulation and downregulation of the investigated genes, respectively. NC (negative control): birds fed basal diet without eugenol nanoemulsion and were not challenged, PC (positive control): birds fed a control diet without eugenol nanoemulsion and were challenged, eugenol nanoemulsion 100, 250, and 400: birds fed basal diet supplemented with 100, 250, and 400 mg/kg diet eugenol nanoemulsion. All groups except NC were challenged with E. coli O78 at 14 days of age. Different letters within the same row indicate a statistical significance (P < 0.05).