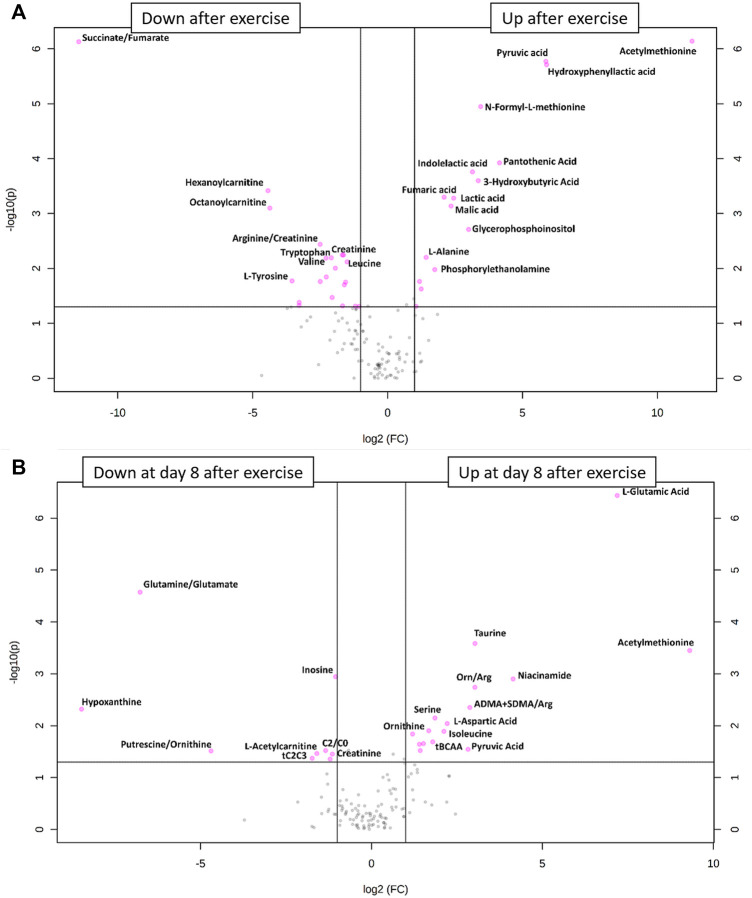
FIGURE 3.
(A) Volcano plot of all metabolite alterations in the short-term (A) and on day 8 after exercise (B) showing the relationship between fold change (log2 fold change (FC); horizontal axis)) and significance (−log10 (p value); vertical axis), respectively. Fold changes describe alterations comparing post- to pre-exercise, using a cut-off point of p ≤ 0.05 and a FC ≥ 2. Metabolites shown as pink points indicate metabolites that were significantly down- or upregulated after (A) or on day 8 after (B) exercise, respectively.

