
FIGURE 8.
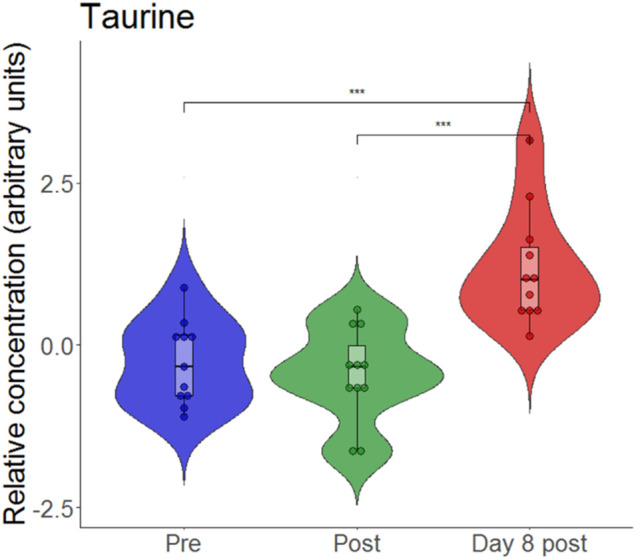
Violin plots with relative blood metabolite concentrations at baseline before (pre), immediately after (post) and on day 8 after (day 8 post) the eccentric exercise performed in hypoxia. ***p ≤ 0.001.
Official websites use .gov
A
.gov website belongs to an official
government organization in the United States.
Secure .gov websites use HTTPS
A lock (
) or https:// means you've safely
connected to the .gov website. Share sensitive
information only on official, secure websites.
Violin plots with relative blood metabolite concentrations at baseline before (pre), immediately after (post) and on day 8 after (day 8 post) the eccentric exercise performed in hypoxia. ***p ≤ 0.001.