
FIGURE 10.
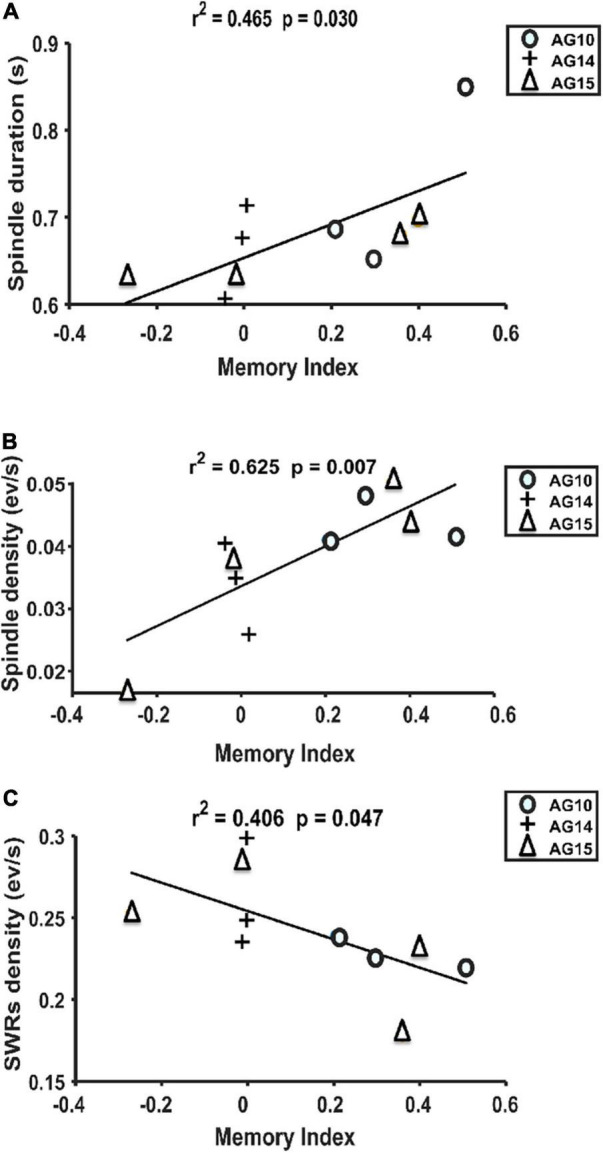
Linear regression between Spindles and SWR features concerning memory performance. (A) Spindle duration and memory performance positively correlate (r2 = 0.465 and p = 0.030). (B) Spindle density (events/min) respect to memory index gets also positively correlated (r2 = 0.625 and p = 0.007). (C) SWR density (events/min) and memory index show a negative correlation (r2 = 0.406 and p = 0.047). Each symbol represents different animals; only those that reached a significant memory index by P32 were included (n = 3). Two data points are missing because one animal did not fall asleep 1 day, and at P32, one animal lost the electrode recording implant.