FIGURE 3.

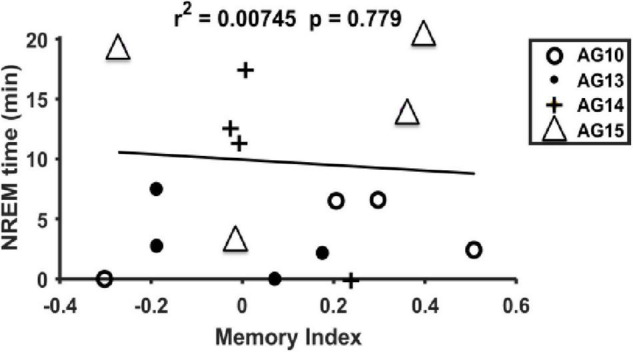
Linear regression between the time spent at NREM and the memory index. NREM time (min during 3 h of resting) vs. memory index for all day and animals (n = 4). No linear relationship was observed (r2 = 0.00745, p = 0.779).

Linear regression between the time spent at NREM and the memory index. NREM time (min during 3 h of resting) vs. memory index for all day and animals (n = 4). No linear relationship was observed (r2 = 0.00745, p = 0.779).