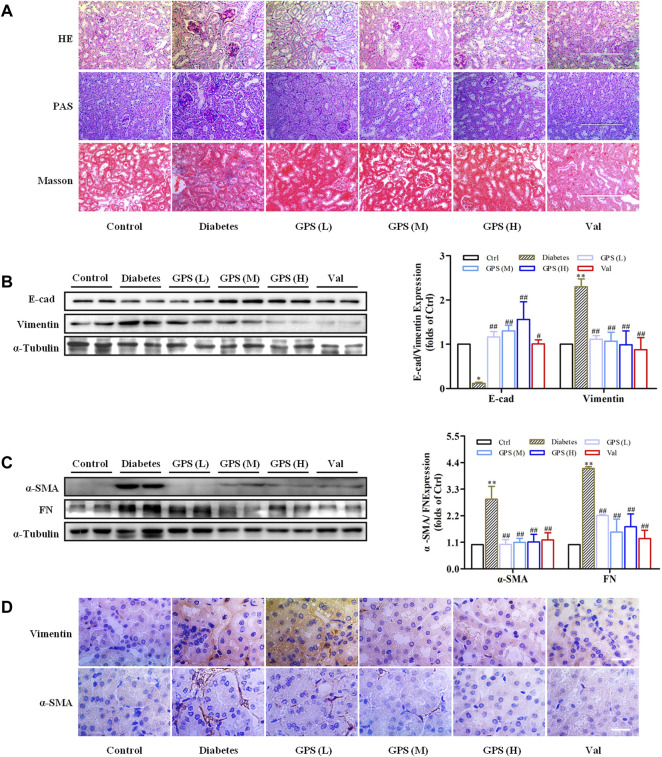
FIGURE 2.
GPS treatment ameliorated renal fibrosis of diabetic mice. (A) Histopathology analysis of renal tubules by HE (scale bar: 200 μm), PAS (scale bar: 200 μm), and Masson (scale bar: 200 μm) staining. (B,C) Protein levels of E-cad, vimentin, α-SMA, and FN in renal tissues of diabetic mice were detected by Western blot. (D) Protein levels of vimentin and α-SMA in renal tubules of diabetic mice were detected by immunohistochemistry. Scale bar: 25 μm. Data were expressed as mean ± SD. n = 8. **p < 0.01 vs. Ctrl. ## p < 0.01 and # p < 0.05 vs. diabetes.

