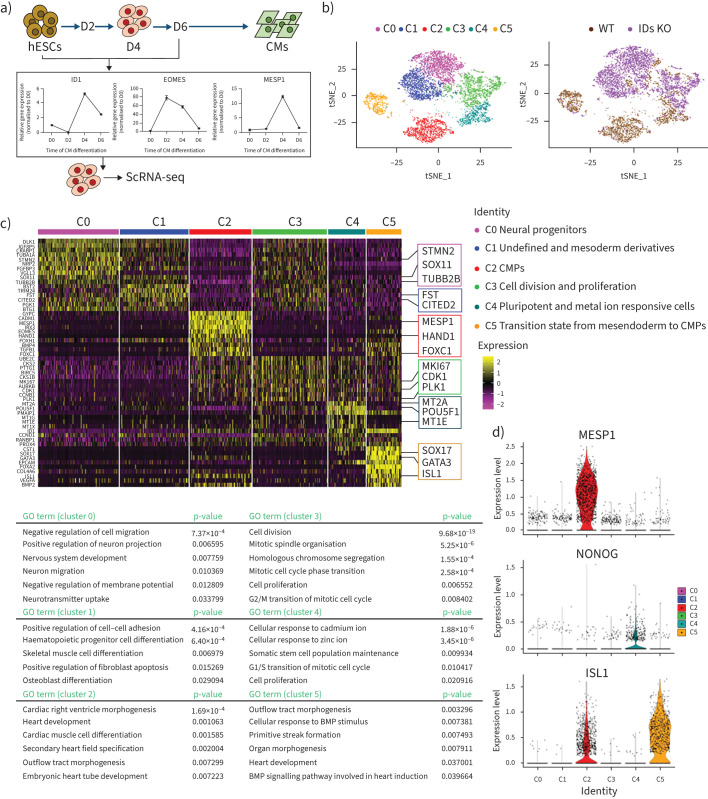
FIGURE 6.
Single-cell (sc) RNA-sequencing (seq) analysis revealed the major affected populations of cardiac mesoderm progenitors in the inhibitors of DNA-binding proteins (IDs) knockout (KO) line. a) Schematic of the differentiation of cardiomyocytes (CMs) differentiated from human embryonic stem cells (hESCs). The mRNA levels of EOMES, MESP1 and ID1 at different stages were measured by quantitative PCR and revealed that day 4 was the key point during differentiation. b) t-Distributed stochastic neighbour embedding with the R-Seurat package showing the different sources of cells analysed (right) and six clusters for wild-type (WT) and IDs KO lines (left) on day 4 of CM differentiation. c) The z-score-scaled average expression levels of differentially expressed genes for six clusters are shown as a heatmap (top), with the selected lineage-specific markers shown on the right. Representative Gene Ontology (GO) terms of biological processes are shown at the bottom. d) The expression level distributions of representative marker genes are shown as violin plots across clusters. Cell lines and clusters are represented by different colours. BMP: bone morphogenetic protein.

