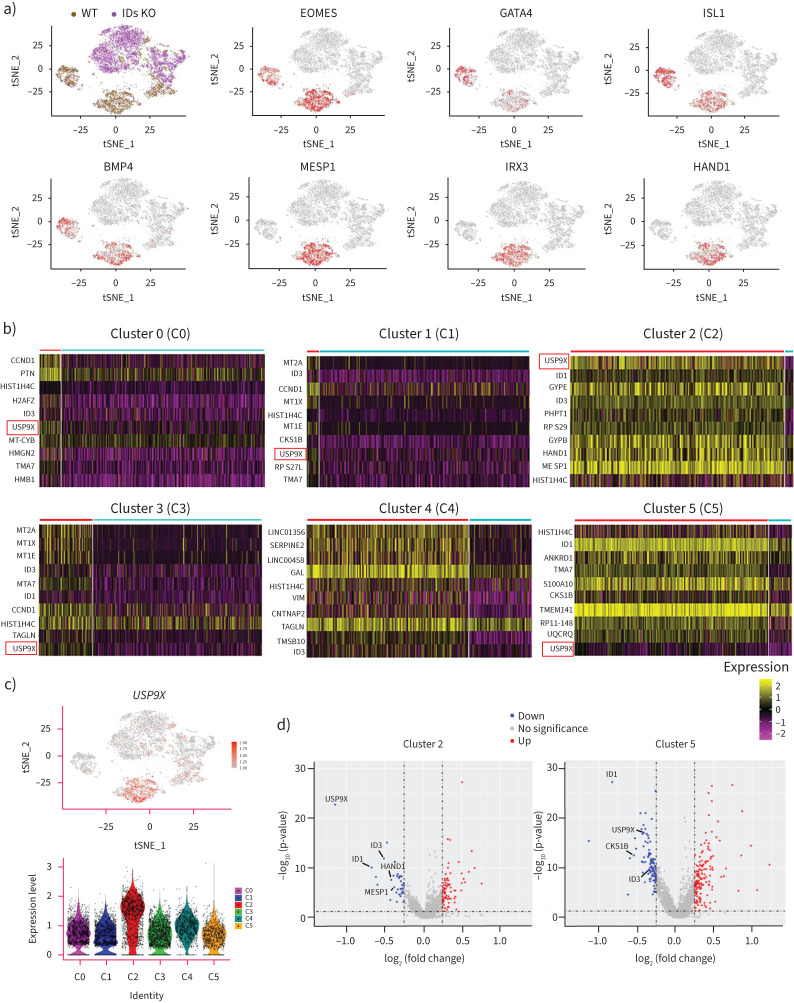
FIGURE 7.
USP9X is a downstream effector gene of deficient inhibitors of DNA-binding proteins (IDs) in cardiac mesoderm progenitors (CMPs). a) t-Distributed stochastic neighbour embedding (t-SNE) visualisation of the key marker genes (EOMES, GATA4, ISL1, BMP4, MESP1, IRX3 and HAND1) in clusters 2 and 5. Cells expressing the representative marker genes are denoted in red. b) The z-score scaled average expression levels of differentially expressed genes (DEGs) between wild-type (WT) cells (red line) and IDs knockout (KO) cells (blue line) for six clusters are shown as heatmaps. c) The expression level distributions of USP9X are shown by t-SNE (upper). Cells expressing representative marker genes are denoted in red. The expression level distributions of USP9X are shown as violin plots in various clusters (lower). Cell lines and clusters are represented by different colours. d) Differential expression level of USP9X, HAND1 and MESP1 and other genes are shown in cluster 2 and USP9X, CKS1B and other genes in cluster 5 as a volcano plot. The size of the dot denotes the percentage of cells within a cluster, while the colour denotes the average expression level across all cells within a cluster.

