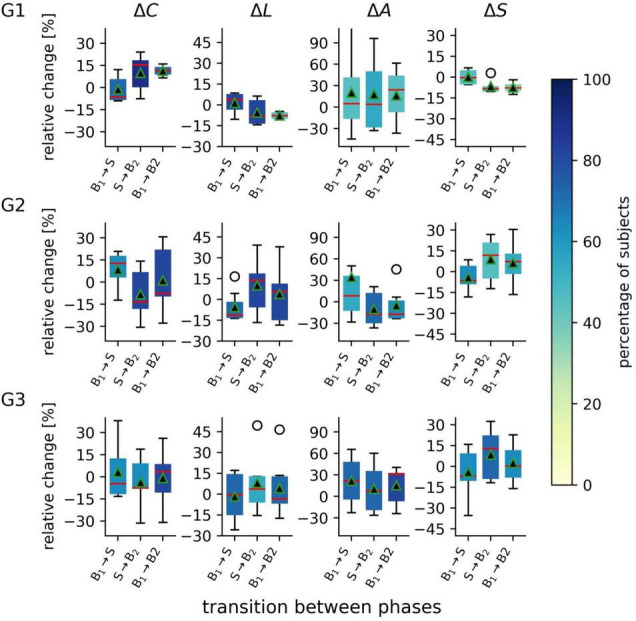
FIGURE 2.

Distributions of taVNS-related alterations in global network characteristics of the three investigated groups (G1 = focal epilepsy group, G2 = generalized epilepsy group, G3 = non-epilepsy group) between the three investigated phases (B1 = pre-stimulation baseline 1, S = stimulation, B2 = post-stimulation baseline 2). Boxplots of relative changes in network characteristics (average clustering coefficient C, average shortest path length L, synchronisability S, and assortativity A). Bottom and top of a box are the first and third quartiles, and the red band and the black triangle are the median and the mean of the distribution. The ends of the whiskers represent the interquartile range of the data. Outliers are marked by an o-sign. Boxes are color coded according to the percentage of subjects for whom significant changes in global network characteristics were observed on per subject base.
