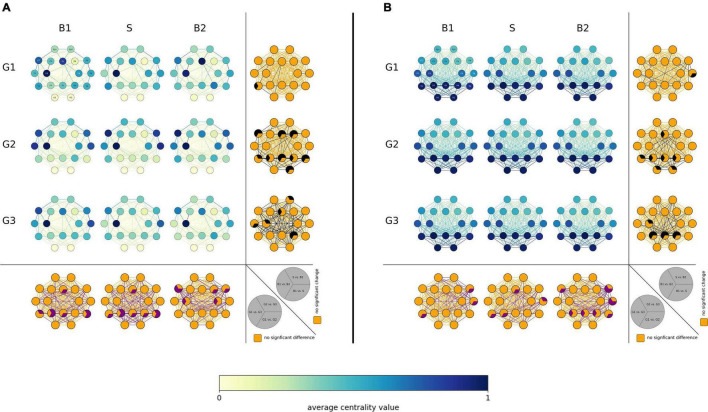
FIGURE 3.
Local network characteristics. [(A) Betweenness centrality CB and (B) eigenvector centrality CE] of the three investigated groups (G1 = focal epilepsy group, G2 = generalized epilepsy group, G3 = non-epilepsy group) in the three investigated phases (B1 = pre-stimulation baseline 1, S = stimulation, B2 = post-stimulation baseline 2). Network vertices arranged according the international 10–20 system for EEG-recording (electrode naming see first plot). Color coding of vertices and edges according to the average centrality values. Bottom: Difference between groups (G1, G2, G3) for local network characteristics in the three investigated phases. Orange: no significance, purple: significant difference (p < 0.05). Right side each plot: Differences between phases (B1, S, B2) for local network characteristics in the three investigated groups. Orange: no significance, black: significant change (p < 0.05).

