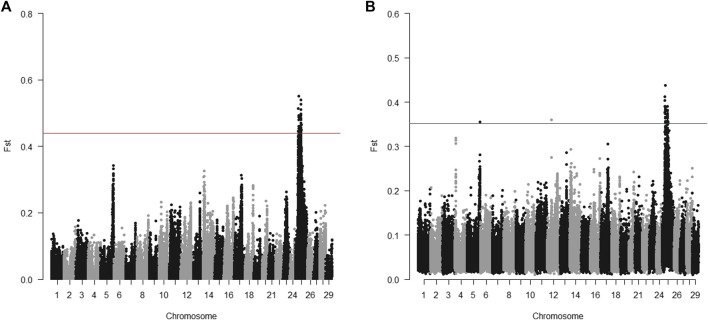
FIGURE 2.
Distribution of Fst between R and S groups of parents for the 2017 generation of the Troutlodge May spawning population. (A) sequencing of individuals; (B) sequencing of pooled samples. The red horizontal lines represent the threshold for significantly different Fst (empirical p < 0.0001).

