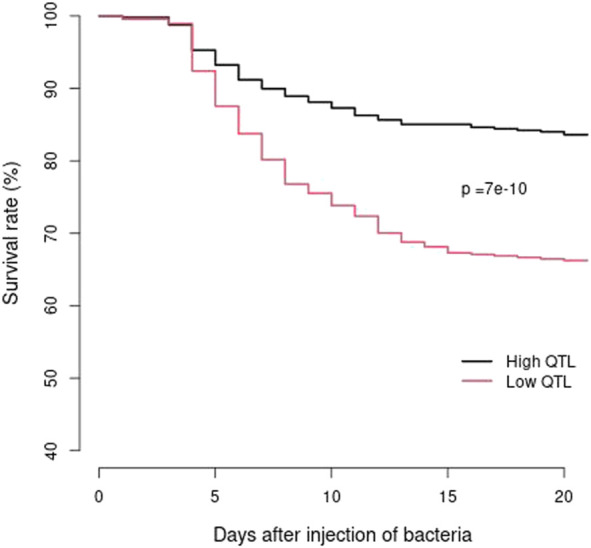
FIGURE 4.

BCWD survival curves of the 2021 generation of the Troutlodge May spawning population. The black curve represents the families with high counts of favorable haplotypes for the two major BCWD QTL regions. The red curve represents the families with low counts of favorable haplotypes for the two major BCWD QTL regions.
