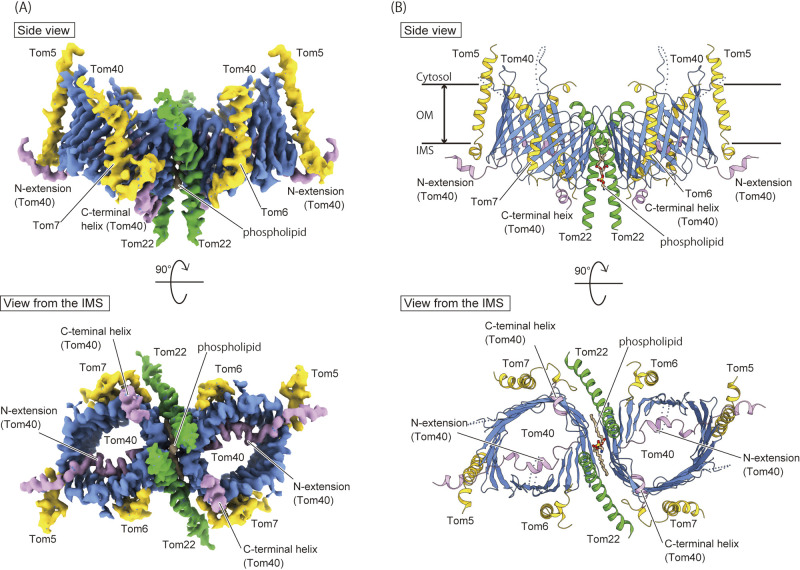
Figure 2 .
The cryo-EM structure of the TOM complex from Saccharomyces cerevisiae at 3.8 Å resolution. (A) Cryo-EM density map of the core dimer of the TOM complex (EMDB-9851). The β-barrel channels of the Tom40 are colored blue, the N-extension and the C-terminal helix are colored in pink, the Tom22 subunit in green, and the small Tom subunits such as Tom5, Tom6 and Tom7 in yellow. The phospholipid molecule inserted between the Tom40 channels is colored in brown. (B) The ribbon presentation of the overall structure of the core dimer of the TOM complex (PDB ID: 6JNF). The coloring scheme is the same as in (A). The ribbon presentations are modified from Ref. 4. Molecular graphics were illustrated with Cuemol 2.0 (http://www.cuemol.org) and UCSF chimeraX (http://www.cgl.ucsf.edu/chimerax/).

