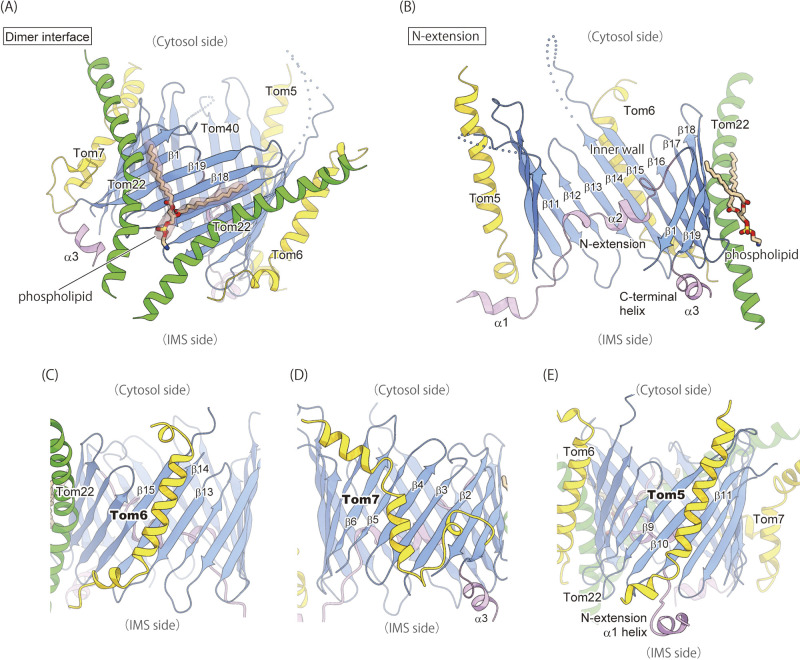
Figure 3 .
The detailed structures of the TOM complex. The coloring scheme is the same as in Figure 2. (A) A close-up view of the dimer interface. Two Tom22 molecules tether the two Tom40 β-barrels. The phospholipid molecule bound to the interface is shown by ball-and-stick model and the EM density is shown by surface representation. (B) A cut-away view of the Tom40 channel. The N-extension and the inner wall are visible because of the removal of strands β2–β8. (C–E) The structures of the transmembrane helices of Tom6 (C), Tom7 (D), and Tom5 (E). Molecular graphics were illustrated with Cuemol 2.0 (http://www.cuemol.org). (A) and (B) are modified from Ref. 4.

