
Figure 2.
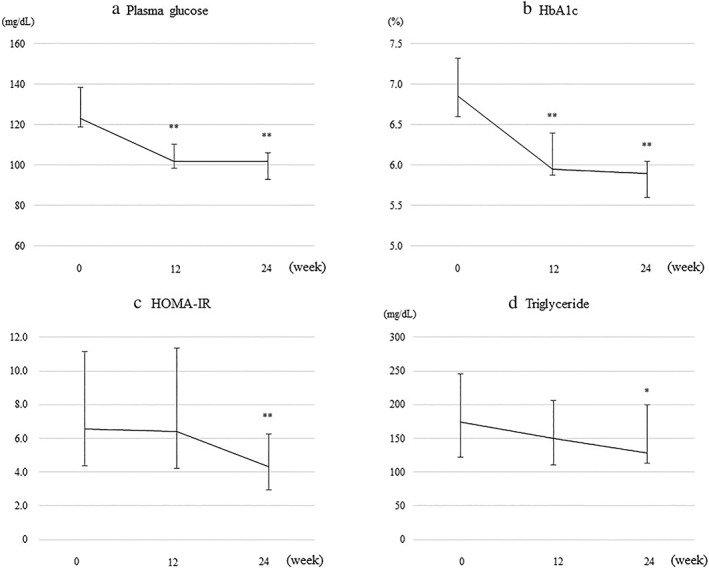
Changes from baseline in (a) plasma glucose, (b) hemoglobin A1c (HbA1c), (c) homeostasis model assessment‐insulin resistance (HOMA‐IR), and (d) triglyceride in patients treated with oral semaglutide for 24 weeks. Error bars show the interquartile range. *P < 0.05, **P < 0.01 versus baseline.