
Figure EV1. Efficacy of DHODH inhibition in the MN murine AML model.
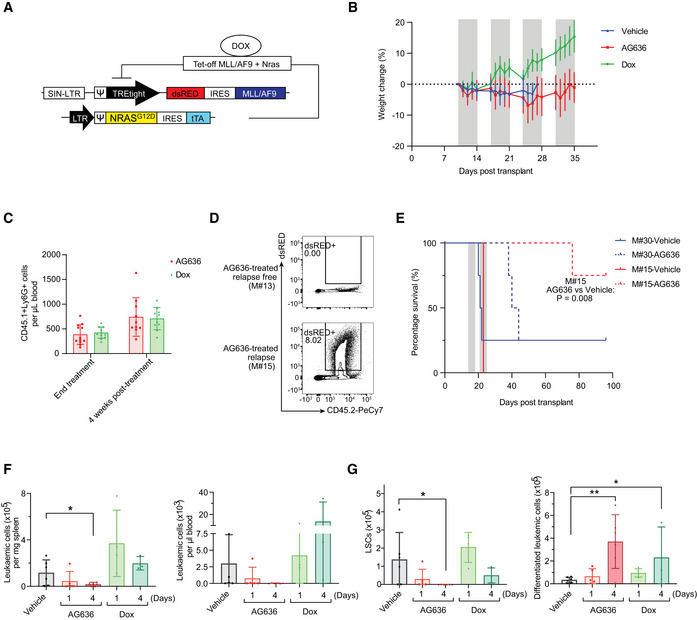
- Schematic of MN model.
- Body weight of MN tumor‐bearing mice treated with AG636. Gray bars denote treatment. Dotted line defines zero percent weight loss.
- Number of recipient‐derived myeloid cells (CD45.1+CD11b+Ly6G+) in the peripheral blood of AG636‐ or doxycycline‐treated recipients at the conclusion of therapy and after 4 weeks (n = 8–10 mice/group).
- Representative FACS plots of the bone marrow from a mouse with no detectable disease (M#13) and a relapsed mouse (M#15).
- Kaplan–Meier survival curve of secondary recipients transplanted with leukemic cells from the relapsed donor (M#15) or a control donor from the vehicle group (M#30). Gray bars denote treatment (n = 4 mice/group, median survival is 21.5 for vehicle‐treated M#30, 42 for AG636‐treated M#30, 23 for vehicle‐treated M#15, and not reached for AG636‐treated M#15, the P value was calculated by log‐rank test).
- Number of MN cells in the spleen and peripheral blood quantified by flow cytometry (n = 3–6 mice/group).
- Number of LSCs (CD11blowcKithighFcgR+) and differentiated leukemic cells (CD182+Ly6G+) in the bone marrow (n = 3–6 mice/group).
Data information: data in F‐G are presented as mean ± SD; P values were calculated using a one‐tailed Student’s unpaired t‐test. *P < 0.05, **P < 0.01, Dox—doxycycline.
Source data are available online for this figure.