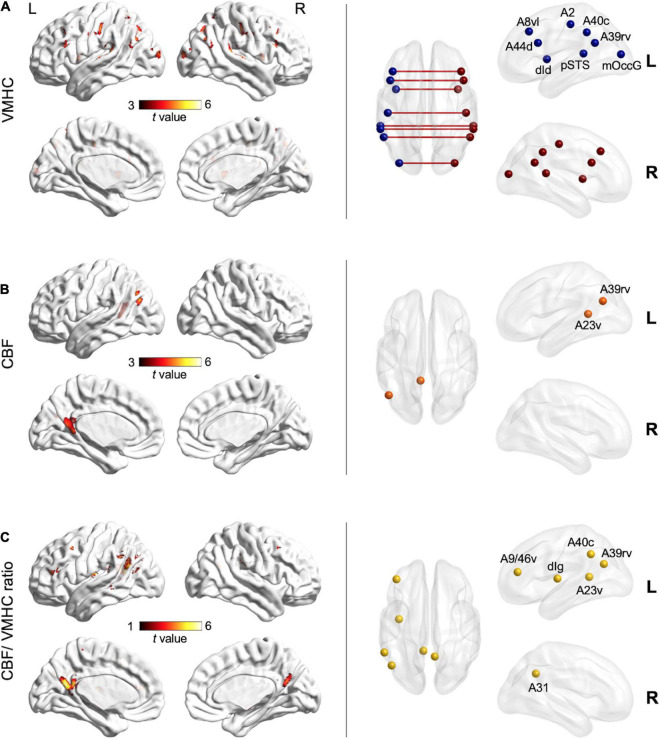
FIGURE 3.
Voxel-wise neurovascular comparisons between the aphasic group and control group (FDR-corrected p < 0.05) after controlling for age, sex, education level, and lesion size. Left column: clusters of warm colors indicate significant decreases in VMHC (A), CBF (B), and the CBF/VMHC ratio (C) in aphasia, respectively, with lighter colors denoting higher t-values and significance. Right column: nodes indicate subregions of the Brainnetome Atlas corresponding to significant clusters. A2, area 2; A23v, ventral area 23; A31, area 31; A39rv, rostroventral area; A40c, caudal area 40; A44d, dorsal area 44; A8vl, ventrolateral area 8; A9/46v, ventral area 9/46; CBF, cerebral blood flow; dId, dorsal dysgranular insula; dIg, dorsal granular insula; mOccG, middle occipital gyrus; pSTS, posterior superior temporal sulcus; VMHC, voxel-mirrored homotopic connectivity.

