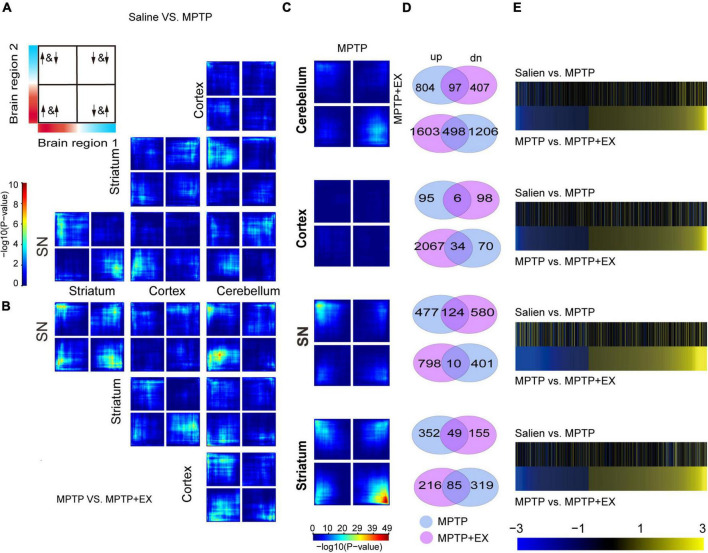
FIGURE 2.
Inter-regional expression patterns reveals PD- and exercise-specific co-upregulation signatures. (A,B) RRHO maps comparing differential expression between 2 brain regions in PD mice [saline vs. MPTP, (A)] and exercised PD mice [MPTP vs. MPTP + EX, (B)]. The upper left in Panel A displays the overlap relationship across brain regions, and signals in the bottom left quarter show the genes overlap in common. The color bar spanning in Panel A represents p-values. (C) RRHO maps comparing differential expression between PD (saline vs. MPTP) and exercised PD mice (MPTP vs. MPTP + EX). (D) Venn diagrams display the overlap genes in MPTP and MPTP + EX in 4 brain regions. (E) Heat maps compare transcriptional changes [log(FC)] in PD to exercised PD mice across brain regions. For each brain region, the top pair of heat maps represents directionality of changes in PD mice for genes expressed in PD mice, while the bottom pair of heat maps represents directionality of changes for genes expressed in exercised PD mice.

