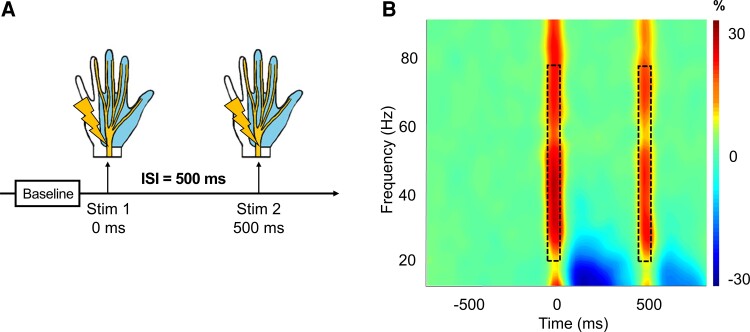
Figure 1.
Task design and time-frequency spectrogram. (A) Overall task design; each epoch was comprised of a baseline (–700 to –300 ms) relative to the onset of the first stimulation at time = 0 ms. The paired-pulse stimulation occurred with an ISI of 500 ms, such that the second stimulus occurred at time = 500 ms. Electrical cutaneous stimulation was applied to the right median nerve which elicits a slight thumb twitch. The light blue region of the hand shows the area served by the right median nerve. (B) Spectrogram displaying time-frequency information from a representative gradiometer found over the left sensorimotor strip. The x-axis represents time (in milliseconds), and the y-axis represents frequency (in Hz). The paired-pulse stimulations occurred at 0 ms (Stimulation 1) and 500 ms (Stimulation 2). The colour bar represents the amplitude threshold (percent change relative to the prestimulus baseline period). Warmer colours indicate an increase in amplitude relative to baseline.

