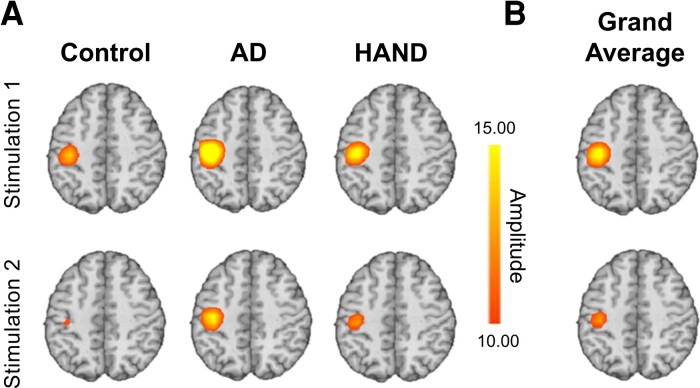
Figure 2.
Beamformer images showing peak somatosensory activity in the left postcentral gyrus. (A) Group averaged images per stimulation. All groups exhibited peak responses in spatially consistent regions of the somatosensory cortex and clear somatosensory gating, although there were group differences observed in the amplitude of the responses. The colour bar embedded shows amplitude thresholds in pseudo t-values as applicable to all images in A and B. The warm colours indicate a neural synchronization event. (B) The peak somatosensory responses averaged across all participants. Of note, the response to Stimulation 1 is far more robust than that of Stimulation 2, indicating a gating effect, with the peak in the left postcentral gyrus.

