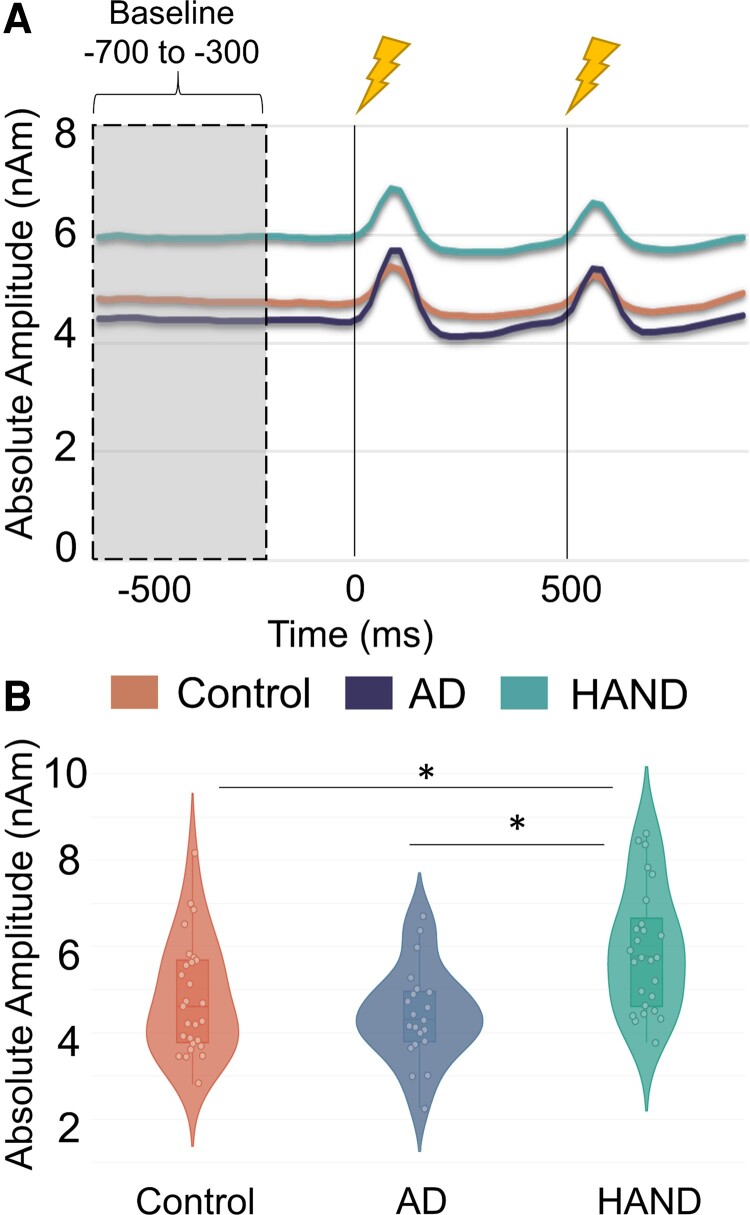
Figure 4.
Virtual sensor time series reveal group differences in spontaneous activity. (A) Absolute amplitude time series showing the non-normalized amplitude as a function of time for the entire epoch in each group. The colour legend appears beneath the time series. As shown, persons with HAND had sharply elevated spontaneous gamma activity during the prestimulus baseline relative to controls and people with Alzheimer’s disease. The grey-shaded area reflects the baseline period (−700 to −300 ms) used to estimate the mean amplitude. The black lines at time = 0 ms and time = 500 ms indicate the onset of the paired-pulse electrical stimulation. (B) Violin plots showing the distribution of mean amplitude values during the prestimulus baseline period. All data points are shown along with the median and interquartile range. A 3 × 1 ANOVA (group × average spontaneous power during the baseline) suggested robust group differences. Follow-up post hoc analyses were conducted. *P < 0.05

