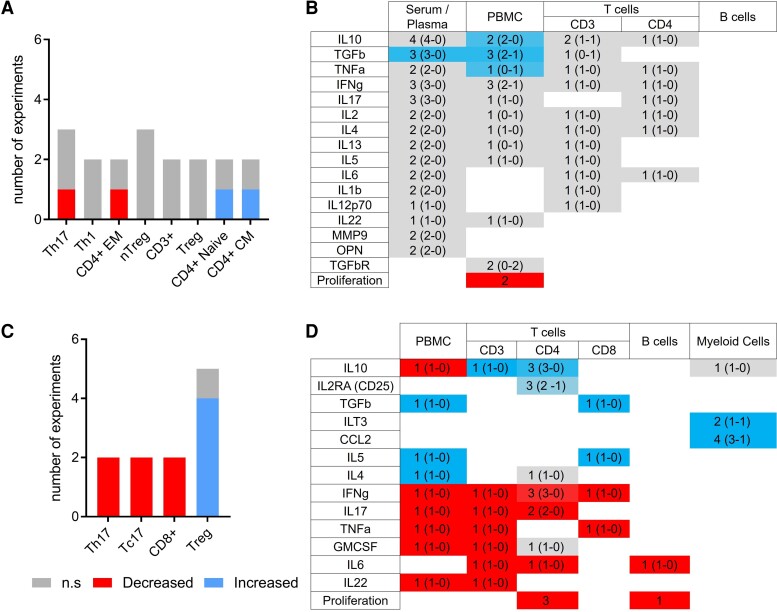
Figure 3.
Main effects and modulations of VitD treatment on immune cells in multiple sclerosis. Effects and modulations of VitD investigated in more than one in vivo (A and B) and in vitro (C and D) studies. Graphs (A and C) represent the number of studies showing significantly increased (blue), decreased (red) or non-significantly modified (grey) cell populations after treatment by VitD. Heat-map (B and D) representing the modifications of circulating and secreted cytokines levels studied after VitD treatment/supplementation. Studies showing a significant increase (n = a), a significant decrease (n = b) or an absence of variation (n = c) were scored as follows: [(a × 2) − (b × 2)]/[(a × 2) + (b × 2) + c]. Red represents a global decrease, blue represents a global increase and grey non-significant or discrepant results. In each case, X (Y–Z) represents the total number of tests (X) and the number of tests realized using FACS/ELISA (Y) or PCR (Z).

