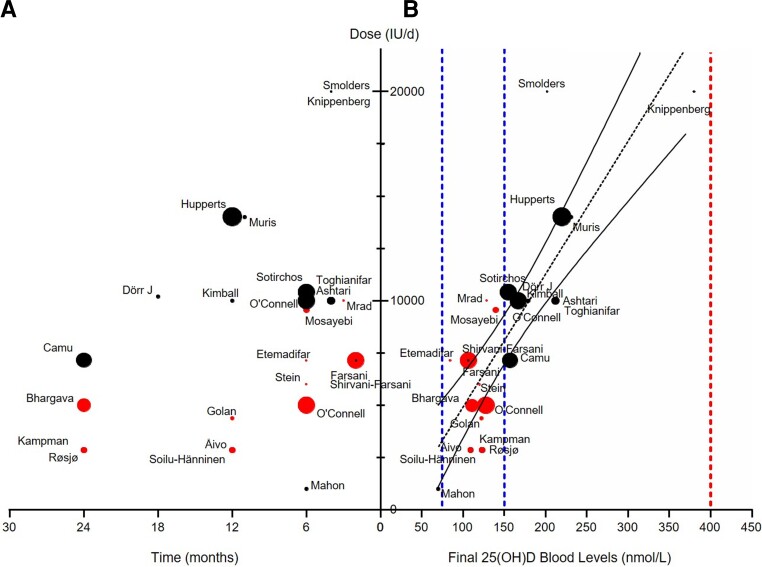
Figure 5.
Correlation between daily dose of VitD and the final blood levels of 25(OH)D from different Phase 2 and Phase 3 RCTs in RRMS patients. (A) Representations of the different clinical studies on the effect of VitD in multiple sclerosis patients according to the dose administered (IU/day) as a function of time (months). (B) Representations of the different clinical studies in multiple sclerosis patients according to the final 25(OH)D blood levels (nmol/l) as a function of time (months). Dots are proportional to the number of patients in each study. Red dots represent studies with final blood VitD levels in the range 75–150 nmol/l as determined by Souberbielle et al., 2019; other studies are represented in black. Linear regression shows a significant correlation between daily dose of VitD and the final blood levels of 25(OH)D [r2 = 0687; 25(OH)D = daily dose/63.5 + 22.5].

