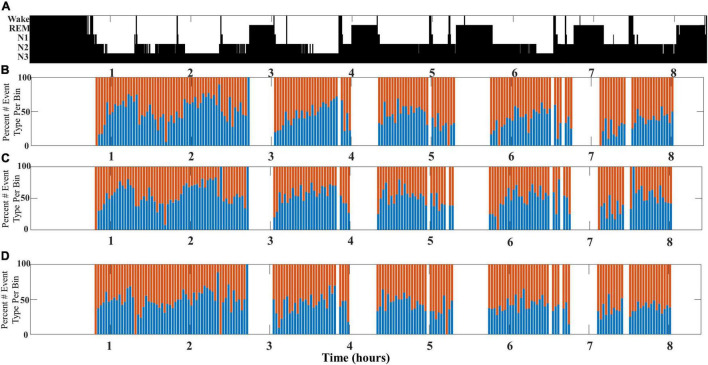
FIGURE 4.
An illustrative example comparing SWA composition as measured from different channel pairs for a single participant (DREAMS Subject 3). (A) A hypnogram marking sleep stages for a single participant’s overnight sleep recording is illustrated. (B) The percentage of early-fast spindle/slow waves (red bars) detected in channel CZ and late-fast spindle/slow waves (blue bars) detected in channel FP1 are graphed in time bins of 2 min. (C) The percentage of early-fast spindle/slow waves (red bars) detected in channel FP1 and late-fast spindle/slow waves (blue bars) detected in channel FP1 are graphed in time bins of 2 min. (D) The percentage of early-fast spindle/slow waves (red bars) detected in channel CZ and late-fast spindle/slow waves (blue bars) detected in channel CZ are graphed in time bins of 2 min.

