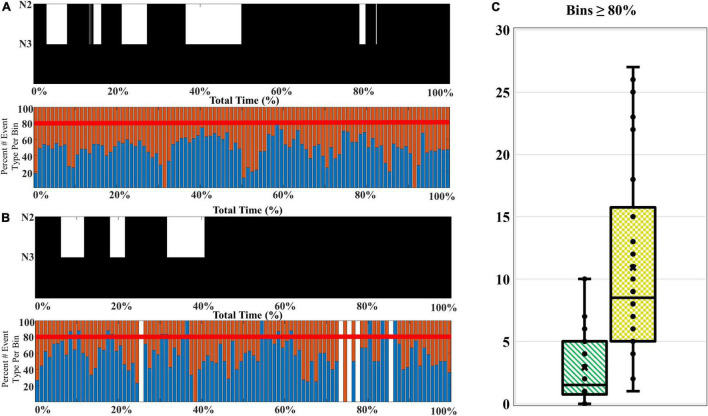
FIGURE 6.
A comparison of the SWA composition among younger and older adults. (A) A younger participant (CFS 800092), age 21-year-old, and (B) an older participant (CFS 800099), age 61-year-old, are presented as an illustrative example of SWA thresholding. The percentage of late-fast spindle/slow wave events (blue bars) and early-fast spindle/slow wave events (red bars) are assessed for bins with 80% or greater late-fast spindle/slow wave composition. (C) The number of bins at or exceeding 80% late-fast spindle/slow wave composition for each participant is quantified, and the younger adults (green-stripes; n = 30) are compared to older adults (yellow-checkered; n = 30) at the group level.

