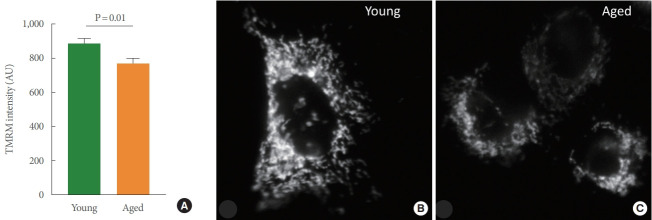
Fig. 2.
(A) Bar graphs depicting the TMRM intensity in cultured UTCs from young and aged rat bladders (N=4 each). Ψm was found to differ significantly (P=0.01) between age groups. (B, C) Representative images of TMRM staining in cultured UTCs from young and aged animals. TMRM, tetramethylrhodamine methyl ester; UTC, urothelial cell.

