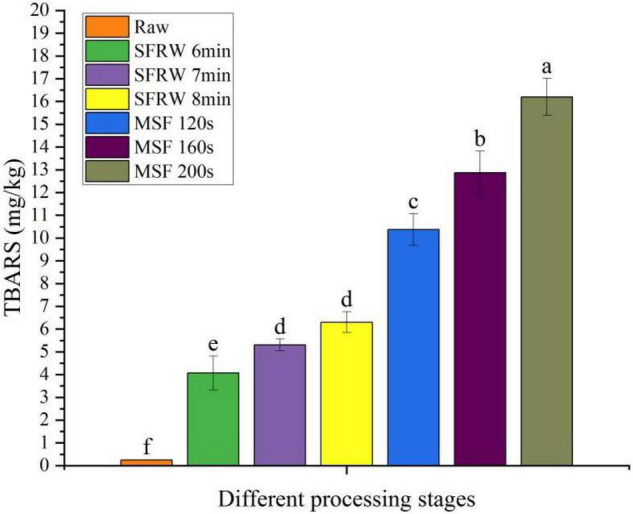
FIGURE 1.

Thiobarbituric acid reactive substances (TBARS) content in different processing stages. Different small letters indicate a significant difference (P < 0.05).

Thiobarbituric acid reactive substances (TBARS) content in different processing stages. Different small letters indicate a significant difference (P < 0.05).