FIGURE 3.

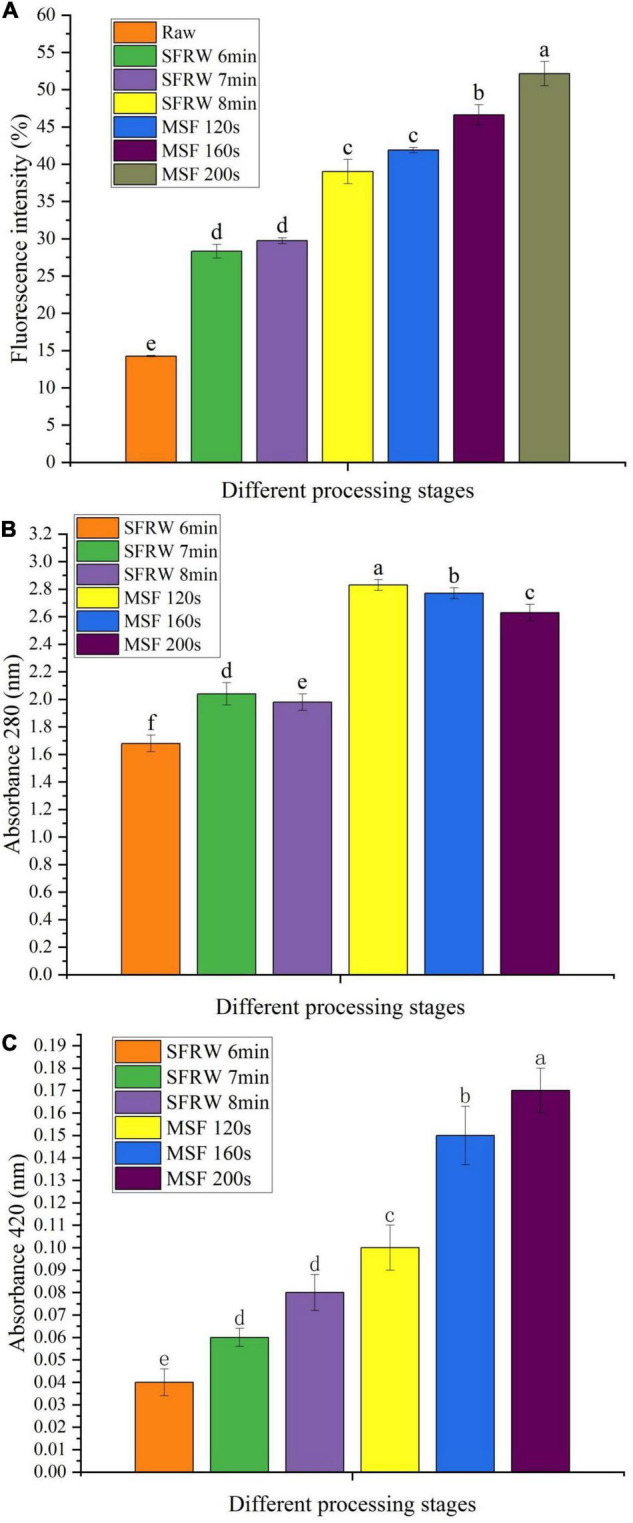
Fluorescence intensity (A) and absorbance at 280 nm (B) and 420 nm (C) of Tan sheep meat stir-fried at different processing stages. Different small letters indicate a significant difference (P < 0.05).

Fluorescence intensity (A) and absorbance at 280 nm (B) and 420 nm (C) of Tan sheep meat stir-fried at different processing stages. Different small letters indicate a significant difference (P < 0.05).