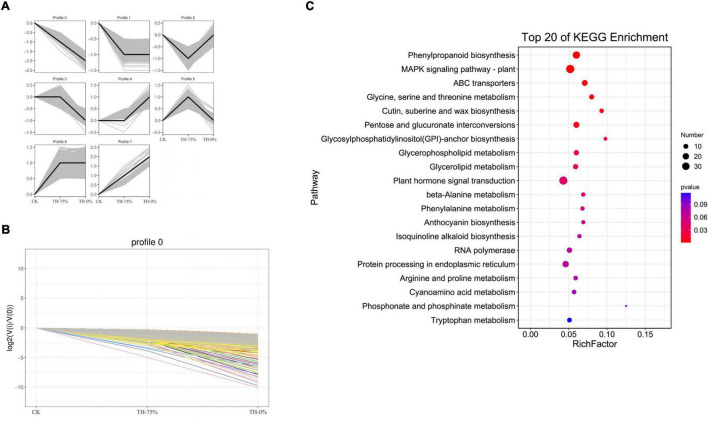
FIGURE 8.
Trend analysis of differentially expressed genes (A), changes in the gene expression level of profile 0 (B), and the pathway of genes in profile 0 can be annotated in the KEGG database (C). From this figure, we can intuitively see the expression changes of genes belonging to this trend, as well as the tightness of aggregation. Each line in the figure represents a gene, and the abscissa is the sample group and the ordinate is the expression change [log2 (Vi/V0)].

