Fig. 1.

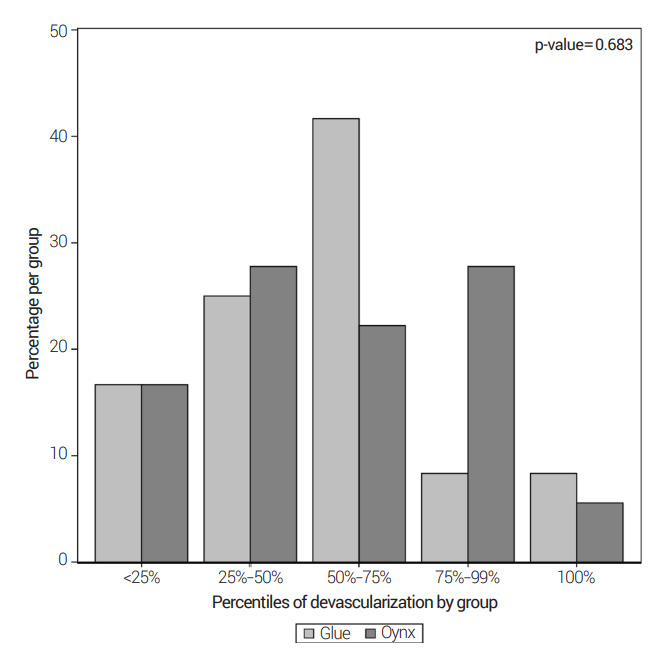
Bar plot demonstrating the distribution of embolization sessions based on percent devascularization, in 25% increment bins, for n-BCA and Onyx groups. n-BCA, n-butyl cyanoacrylate

Bar plot demonstrating the distribution of embolization sessions based on percent devascularization, in 25% increment bins, for n-BCA and Onyx groups. n-BCA, n-butyl cyanoacrylate