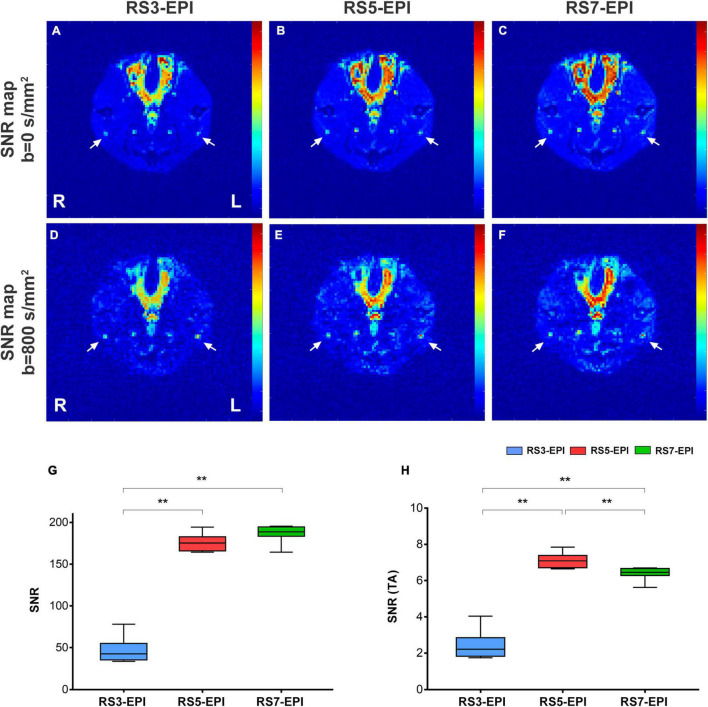
FIGURE 2.
SNR maps (A–F), SNR value (G), and SNR (TA) value (H) for RS3-EPI, RS5-EPI, and RS7-EPI. The measured SNR value increases with increasing segmented (G) for the three EPI sequences. Regarding SNR-values corrected for the acquisition time, RS5-EPI yielded significantly higher SNR than RS3-EPI and RS7-EPI (H). SNR, signal-to-noise ratio; SNR(TA), SNR Correction due to sequence-specific differences in acquisition time (H). **P ≤ 0.017, post hoc analysis with Bonferroni corrected.

