. 2022 Jul 7;12(31):19703–19716. doi: 10.1039/d2ra03027f

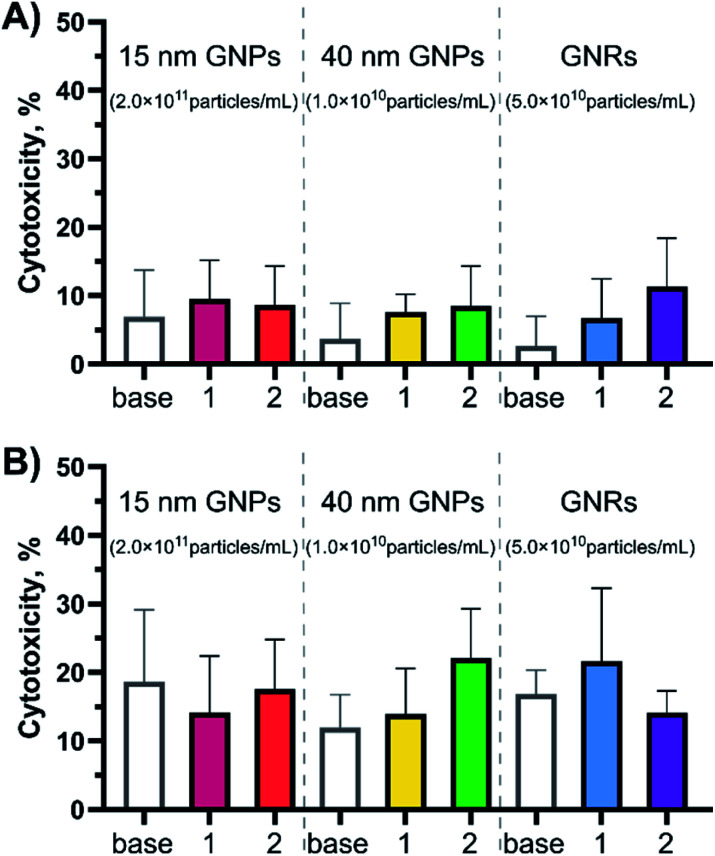
Fig. 2. Cytotoxicity profiles for the peptide-coated GNPs and GNRs at different time points (A) 4- and (B) 24 hour exposure times. Cytotoxicity was evaluated in BMDCs (20 × 103 cells per well) with the LDH release assay (N = 2, n = 3) at the highest concentration used for each experimental group (15 nm GNPs – ∼2.0 × 10¹¹ particles per mL; 40 nm GNPs – ∼1.0 × 10¹⁰ particles per mL; GNRs – ∼5.0 × 10¹⁰ particles per mL in the cell exposure medium). PBS was used as the negative control (0% cytotoxicity) and assay lysis buffer was used as the positive control (100% cytotoxicity). Error bars indicate standard deviations calculated using GraphPad Prism software. ANOWA (one-way) showed there was no significant difference inside the test groups (p ≥ 0.05). For the cytotoxicity profiles for more nanoparticle concentrations see Fig. S3..

Fig. 2