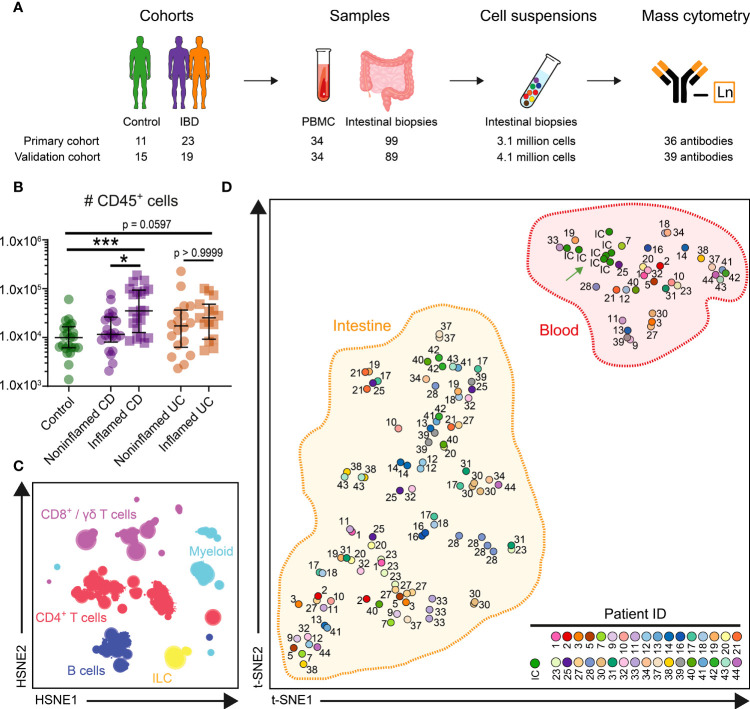
Figure 1.
HSNE identifies major immune lineages in blood and intestine. (A) Experimental approach (B) Graph showing absolute number of CD45+ immune cells acquired from 99 intestinal biopsies of the primary cohort. Bars indicate the median with interquartile range. *p≤0.05, ***p≤0.001, Kruskal Wallis test for multiple groups. (C) Overview HSNE embedding of 7.7 million immune cells. Color represents the major lineages. (D) t-SNE analysis (% of CD45+ cells) of clustered cells for 133 samples and 7 internal control (IC) replicate samples. Every dot represents a sample, and the color and number display 34 individuals and the IC. t-SNE analysis (% of CD45+ cells) of clustered cells for 133 samples and 7 internal control (IC) replicate (green arrow) samples.

