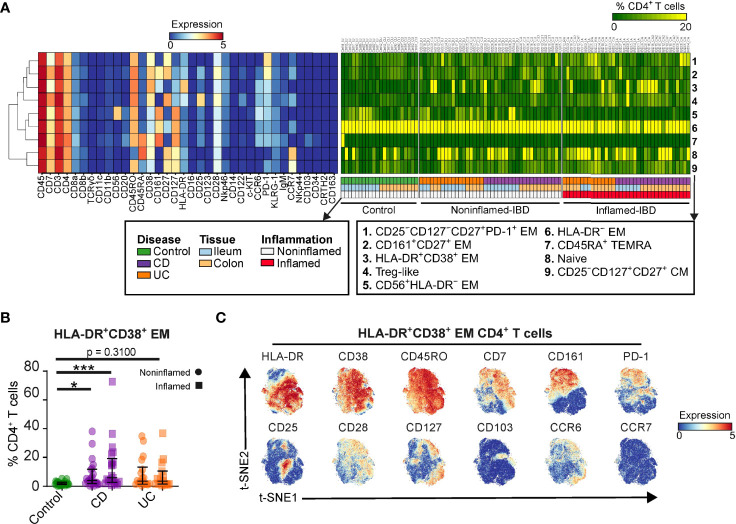
Figure 2.
The CD4+ T cell lineage dissected into distinct cell subsets. (A) Heatmaps showing characteristics of 9 CD4+ T cell subsets (marker expressions; rainbow scale), cell subset composition of intestinal samples (cell percentages; green-to-yellow scale), clinical metadata and hierarchical clustering of marker expression profiles. (B) Graph showing cell frequency of HLA-DR+CD38+ EM CD4+ T cell cluster for 99 intestinal biopsies of the primary cohort. Bars indicate the median with interquartile range. *p≤0.05, ***p≤0.001, Kruskal Wallis test for multiple groups. (C) t-SNE embedding showing 61,930 cells colored for the expression values of the indicated markers.

