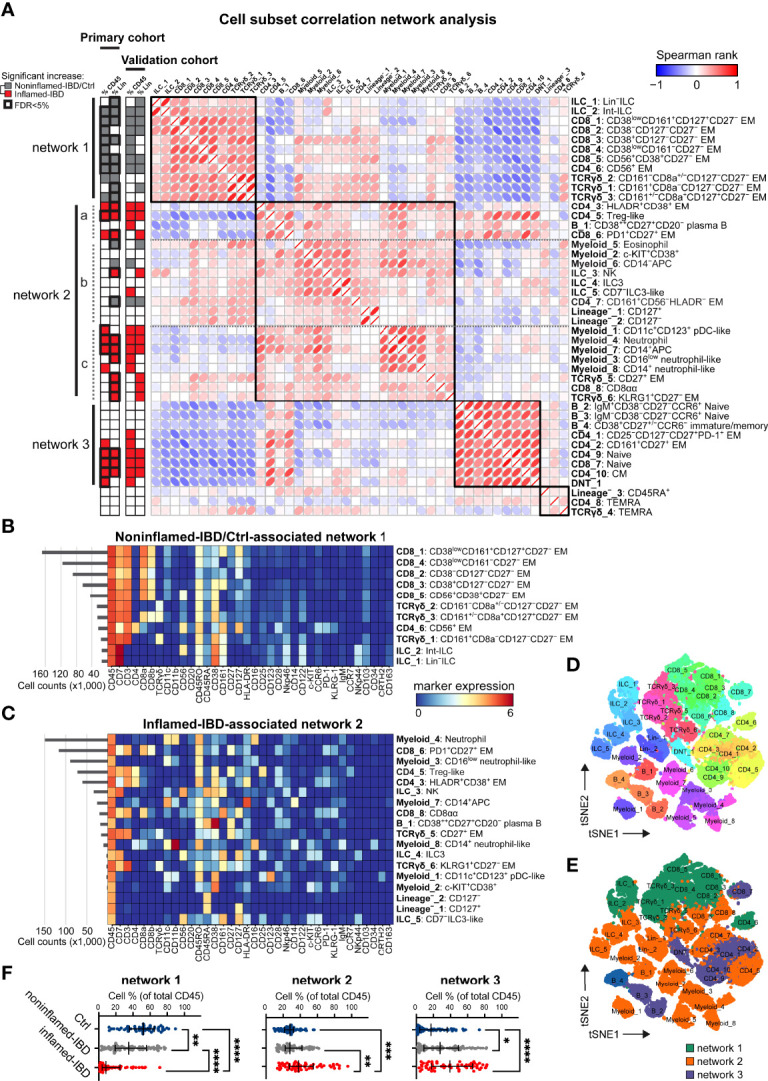
Figure 3.

Integrated immune system analysis identifies IBD-associated cellular networks. (A) Network representation of correlations (Spearman rank) between 44 immune subsets. Hierarchical clustering of correlations indicated by four black squares. Statistics bar (left panel) indicating significant (p<0.05) differences in cell frequencies comparing inflamed-IBD (in red) samples with noninflamed-IBD/control samples (in grey) as determined with independent t-tests stratified for the primary and the validation cohort. False discovery rate <5% highlighted with bold outline for the primary cohort. Heatmaps showing maker expressions of relevant cell subsets from (B) network 1 and (C) network 2 as defined in panel (A) t-SNE maps of immune subsets (each downsampled to 1,000 cells) from the three networks and colored for (D) immune subset and (E) corresponding network. (F) Graphs showing the collective cell subset frequencies (as % of total CD45+ cells) of network 1, network 2 and network 3, for 53 control, 76 noninflamed-IBD and 59 inflamed-IBD intestinal samples from the primary and the validation cohorts combined. Bars indicate the median with interquartile range. *p≤0.05, **p≤0.01, ***p≤0.001, ****p≤0.0001, Kruskal Wallis test for multiple groups.
