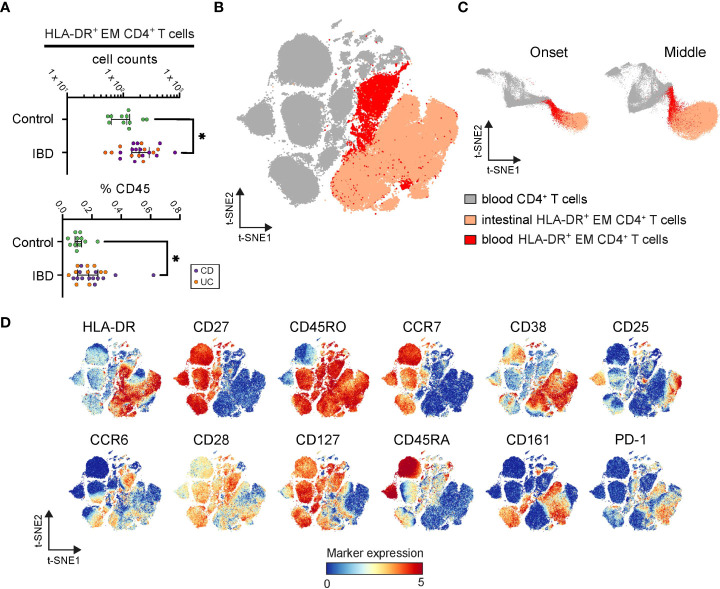
Figure 5.
Identification of inflamed instestine-associated CD4+ T cells in blood. (A) Graphs show frequencies of blood CD4+ T cells linked to the intestinal HLA-DR+ EM phenotype in each PBMC sample. Bars indicate the median with interquartile range. *p≤0.05, Mann-Whitney test. (B) t-SNE embedding of blood CD4+ T cells (grey) and classified blood CD4+ T cells linked to the intestinal HLA-DR+ EM phenotype (red) from 34 PBMC samples, and the HLA-DR+ CD4+ EM T cells (apricot) from 99 intestine samples. (C) t-SNE embedding at the onset and the middle of the computation. (D) t-SNE embedding colored for the expression values of the indicated markers.

