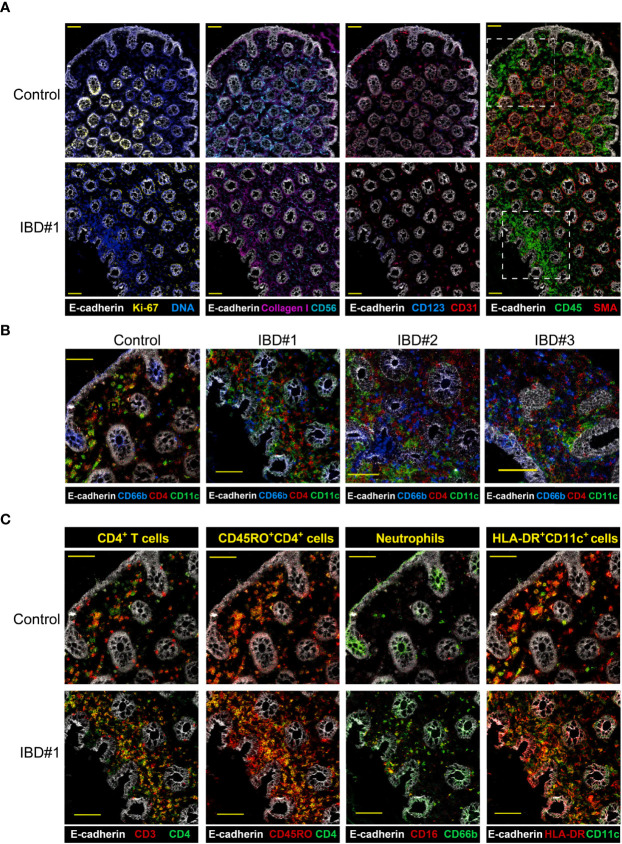
Figure 6.
Imaging-mass cytometry reveals immune cell aggregates in the inflamed intestine. Representive images (A) structural markers (E-cadherin, Ki67, DNA, Collagen I, CD56, CD31, SMA) and CD45 expression are depicted for IBD biopsies from a control and three IBD patients, yellow scale bar: 100 μm. (B) Major immune lineage markers (CD4, CD11c) together with E-cadherin present in a region of a control and three IBD biopsies (dotted line in panel (A), yellow scale bar: 50 μm. (C) Co-expresion of CD3 and CD45RO with CD4, CD16 with CD66b, and HLA-DR with CD11c in the same region highlighted in panel (A) for a control and an IBD patient biopsy; scale bar: 50 μm.

