
Figure 2. Uterus Transplants per Year in the US (2016-2021) and Uterine Graft Survival .
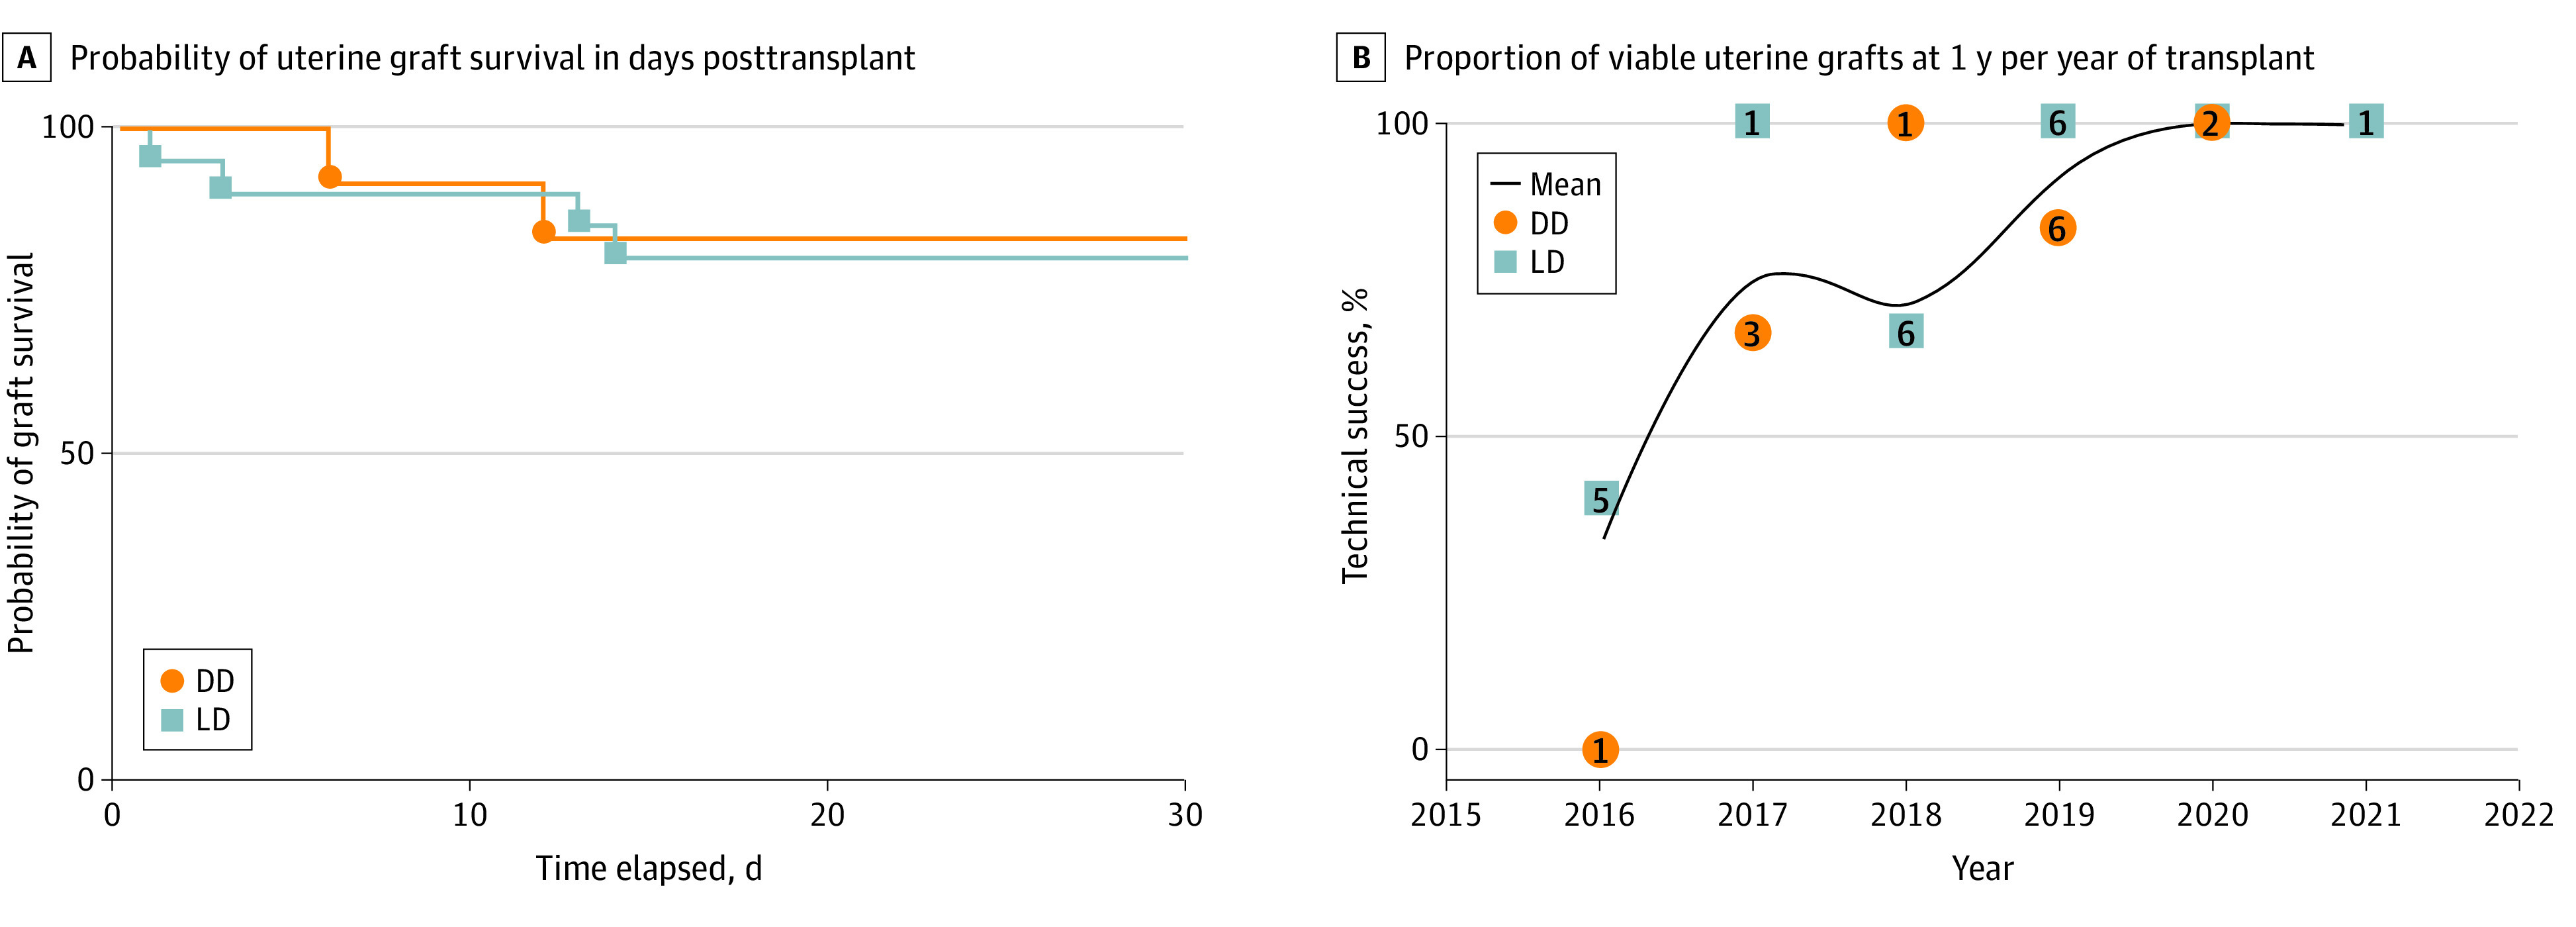
A, Probability of uterine graft survival from living donors (LDs) and deceased donors (DDs). B, Proportion of viable uterine grafts at 1 year. Numbers indicate the number of transplants per year. The trend line indicates the mean percentage of technical success for all recipients.