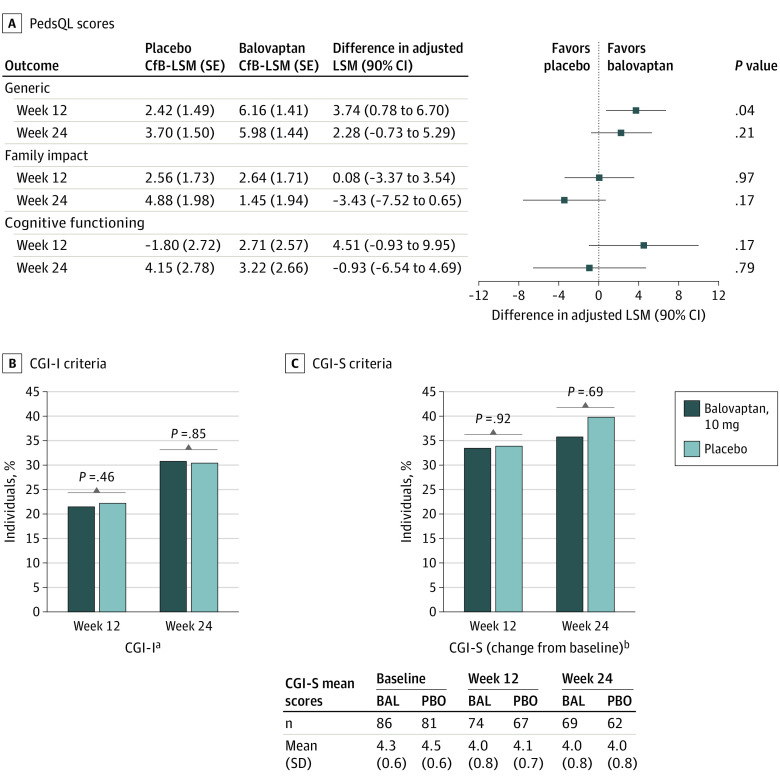
Figure 3. Treatment Differences for Pediatric Quality of Life Inventory (PedsQL) Scores and Clinical Global Impression (CGI) Responders .
A, Differences in adjusted least-squares mean (LSM) for PedsQL scores derived using mixed models for repeated measurement analysis are shown. Generic at week 12: placebo (n = 62) and balovaptan (n = 72); week 24: placebo (n = 59) and balovaptan (n = 65); family impact at week 12: placebo (n = 68) and balovaptan (n = 73); week 24: placebo (n = 62) and balovaptan (n = 67); cognitive functioning at week 12: placebo (n = 63) and balovaptan (n = 72); week 24: placebo (n = 59) and balovaptan (n = 65). B, CGI-Improvement (CGI-I) and C, CGI-Severity (CGI-S) week 12: placebo (n = 67) and balovaptan (n = 74); week 24: placebo (n = 62) and balovaptan (n = 68/69 [CGI-I/CGI-S]). BAL indicates balovaptan; CfB, change from baseline; PBO, placebo.
aPercentage of responders with scores of 1 (much improved) or 2 (very much improved).
b Percentage of individuals with an improvement in their rating of CGI-S of at least 1 point.

