
FIGURE 8.
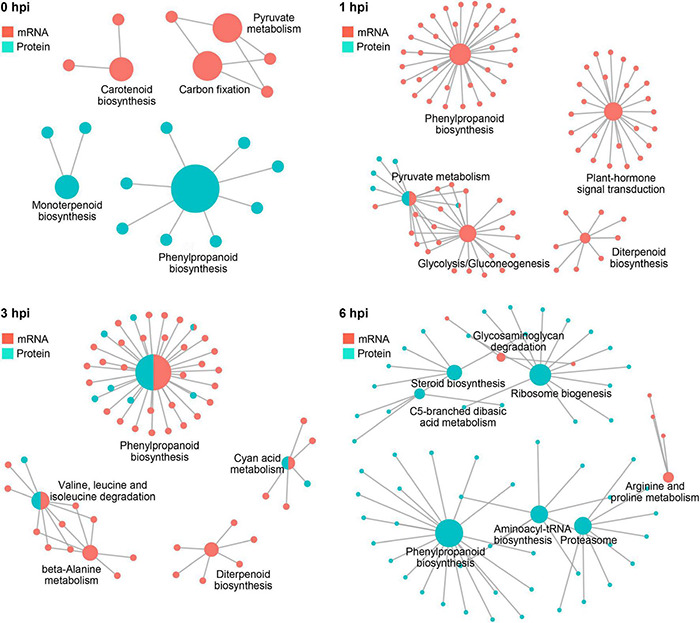
The complex association between enriched KEGG pathways. Plots showing KEGG pathways significantly enriched by DEGs and DEPs detected in RNA-seq and proteomics at 0, 1, 3, and 6 hpi.
Official websites use .gov
A
.gov website belongs to an official
government organization in the United States.
Secure .gov websites use HTTPS
A lock (
) or https:// means you've safely
connected to the .gov website. Share sensitive
information only on official, secure websites.
The complex association between enriched KEGG pathways. Plots showing KEGG pathways significantly enriched by DEGs and DEPs detected in RNA-seq and proteomics at 0, 1, 3, and 6 hpi.