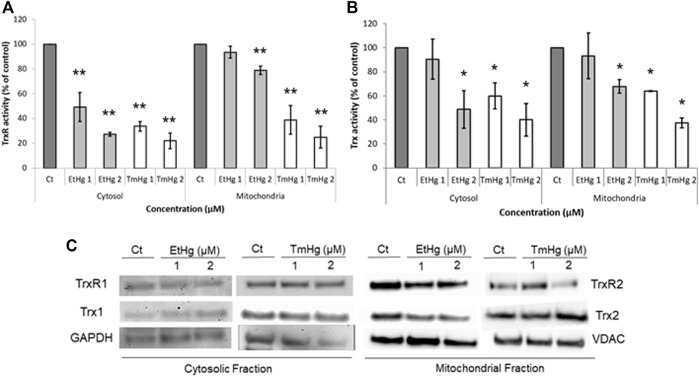
FIGURE 3.
Effect of TmHg and EtHg on TrxR (A) and Trx (B) Activity and Expression (C) in the cytosol and mitochondria of GL261 cells. Cells were exposed to mercury compounds (1 and 2 µM) for 24 h and activities were measured by the insulin end-point assay in the cytosol and mitochondria after the separation of organelles as described in materials and methods. Expression levels were determined by western blots and results were normalized for protein loading on the gel with GAPDH and VDAC for cytosol and mitochondria, respectively, and Ponceau-S. Data in A and B are expressed as activity relative to non-treated control and the values are mean ± SEM of three to four independent experiments. Data in C demonstrate the blots. ∗ p < 0.05, ∗∗ p < 0.01 from non-treated control experiments.

