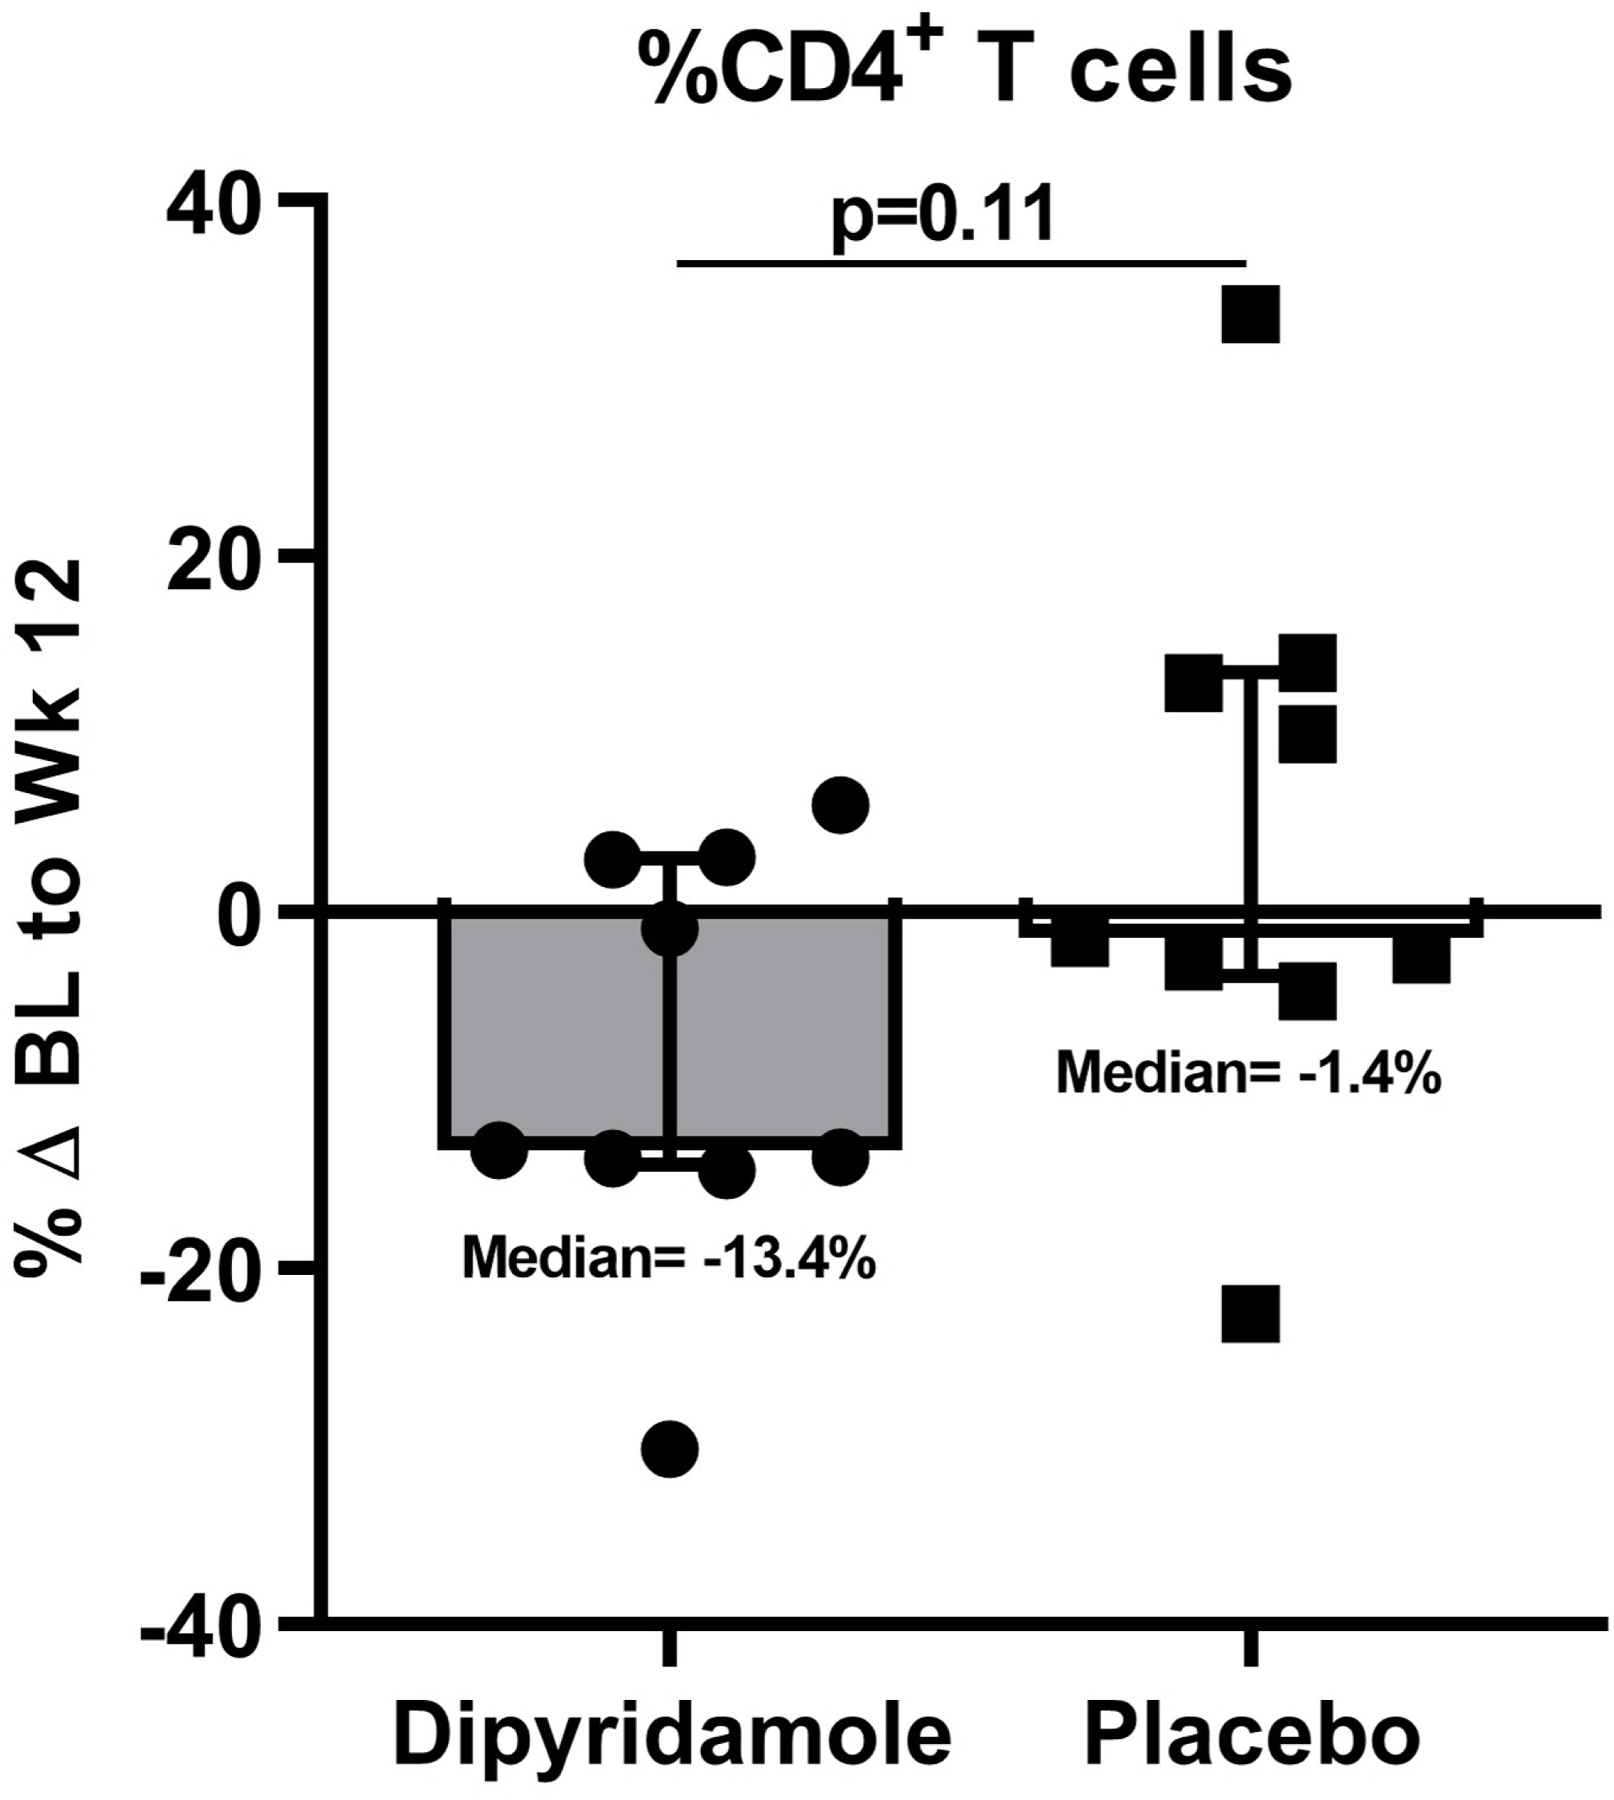
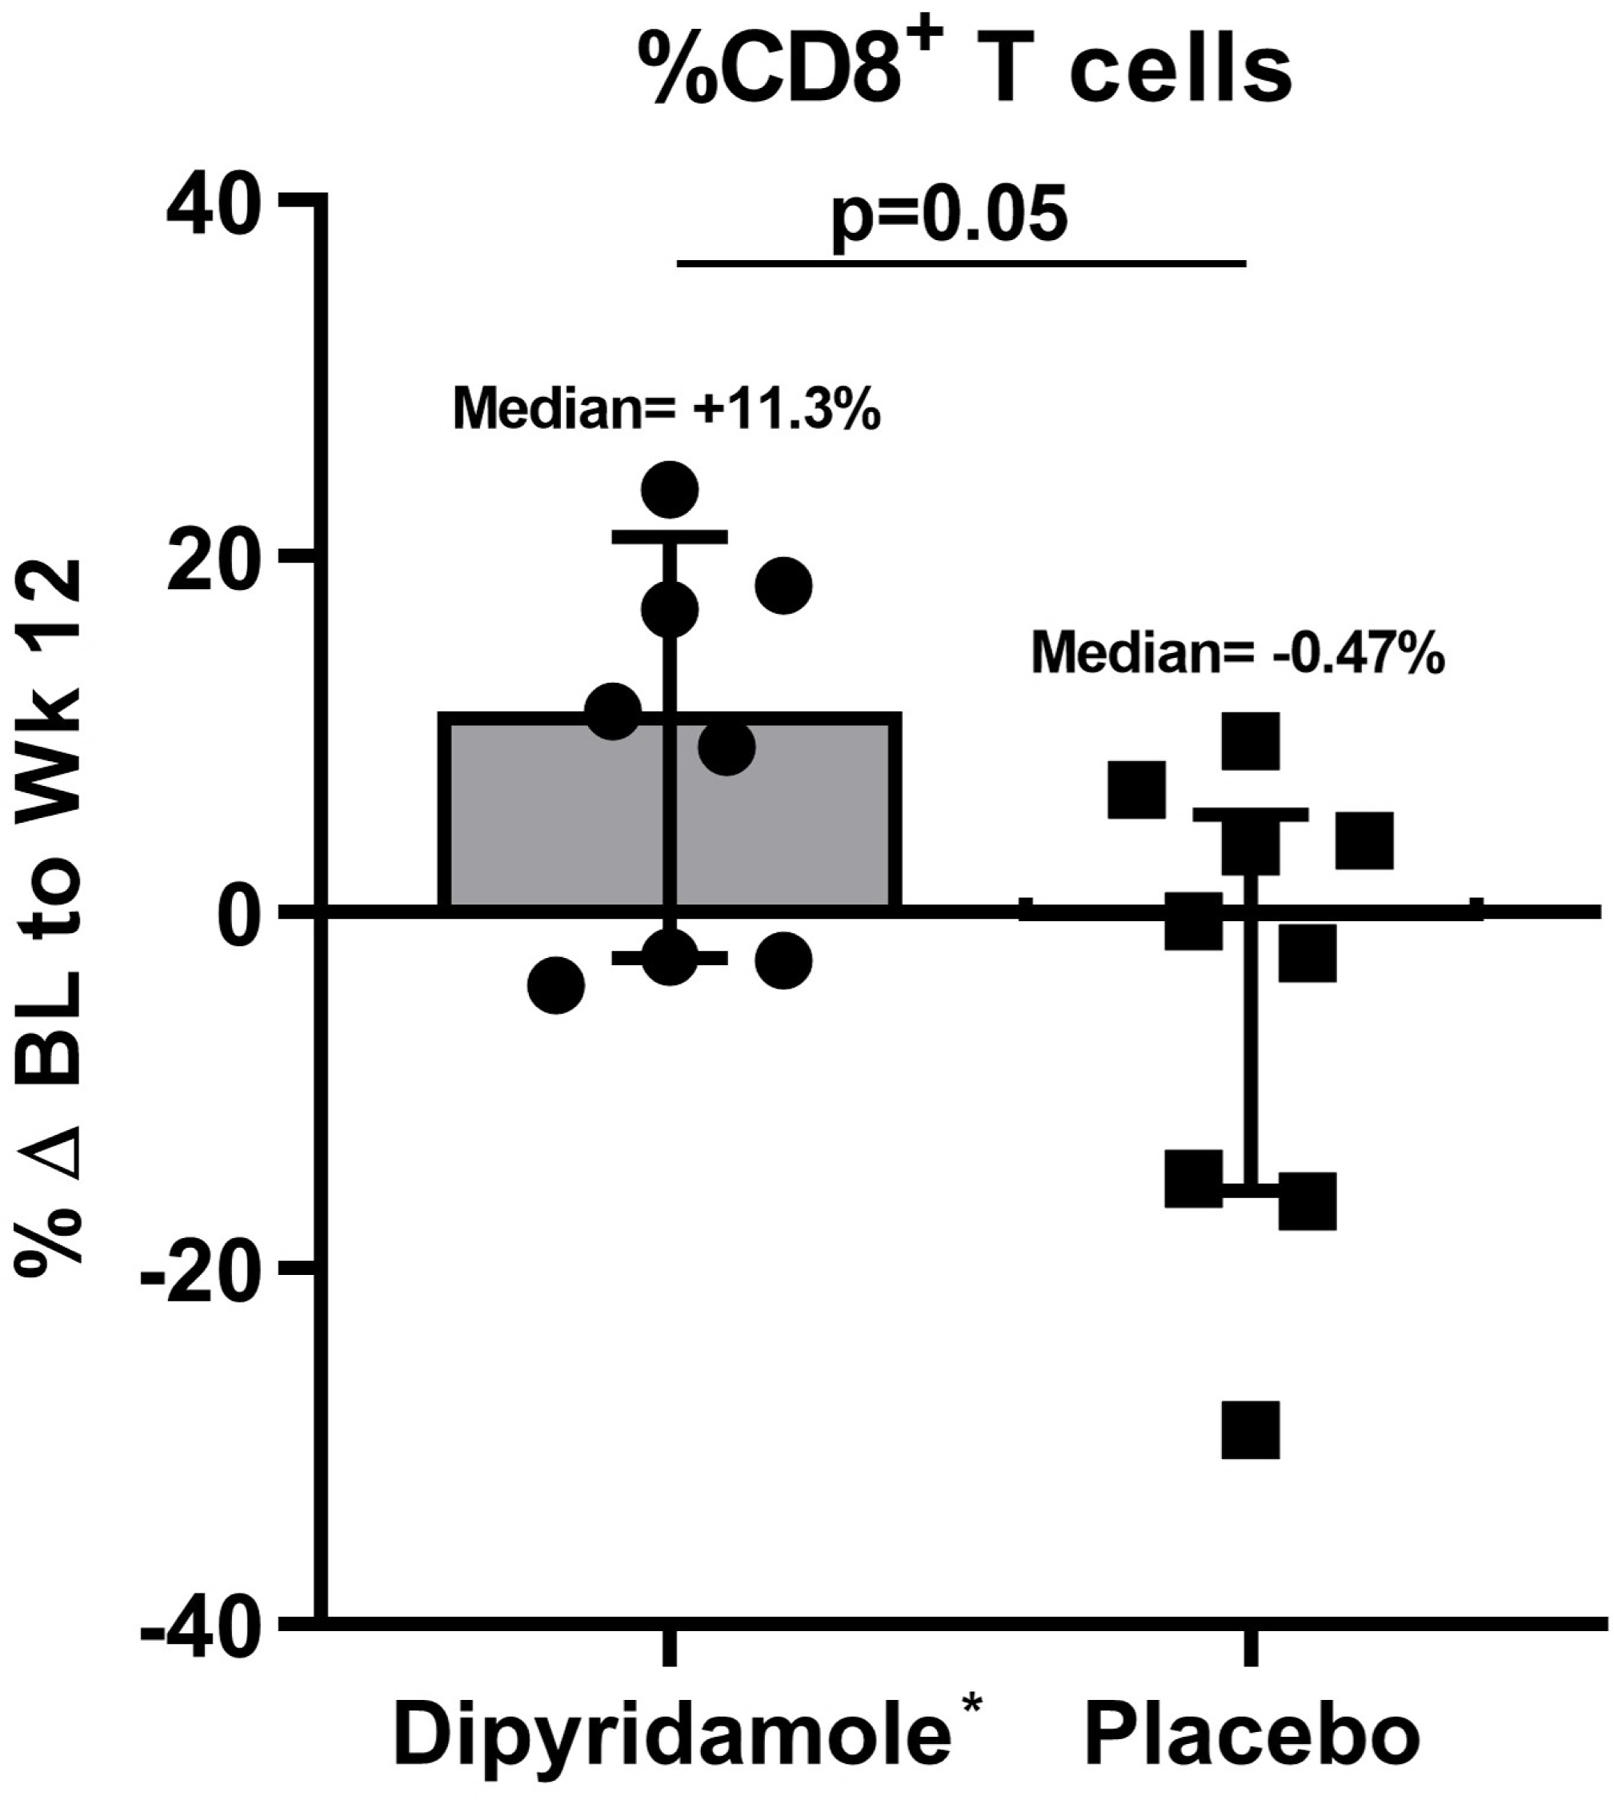
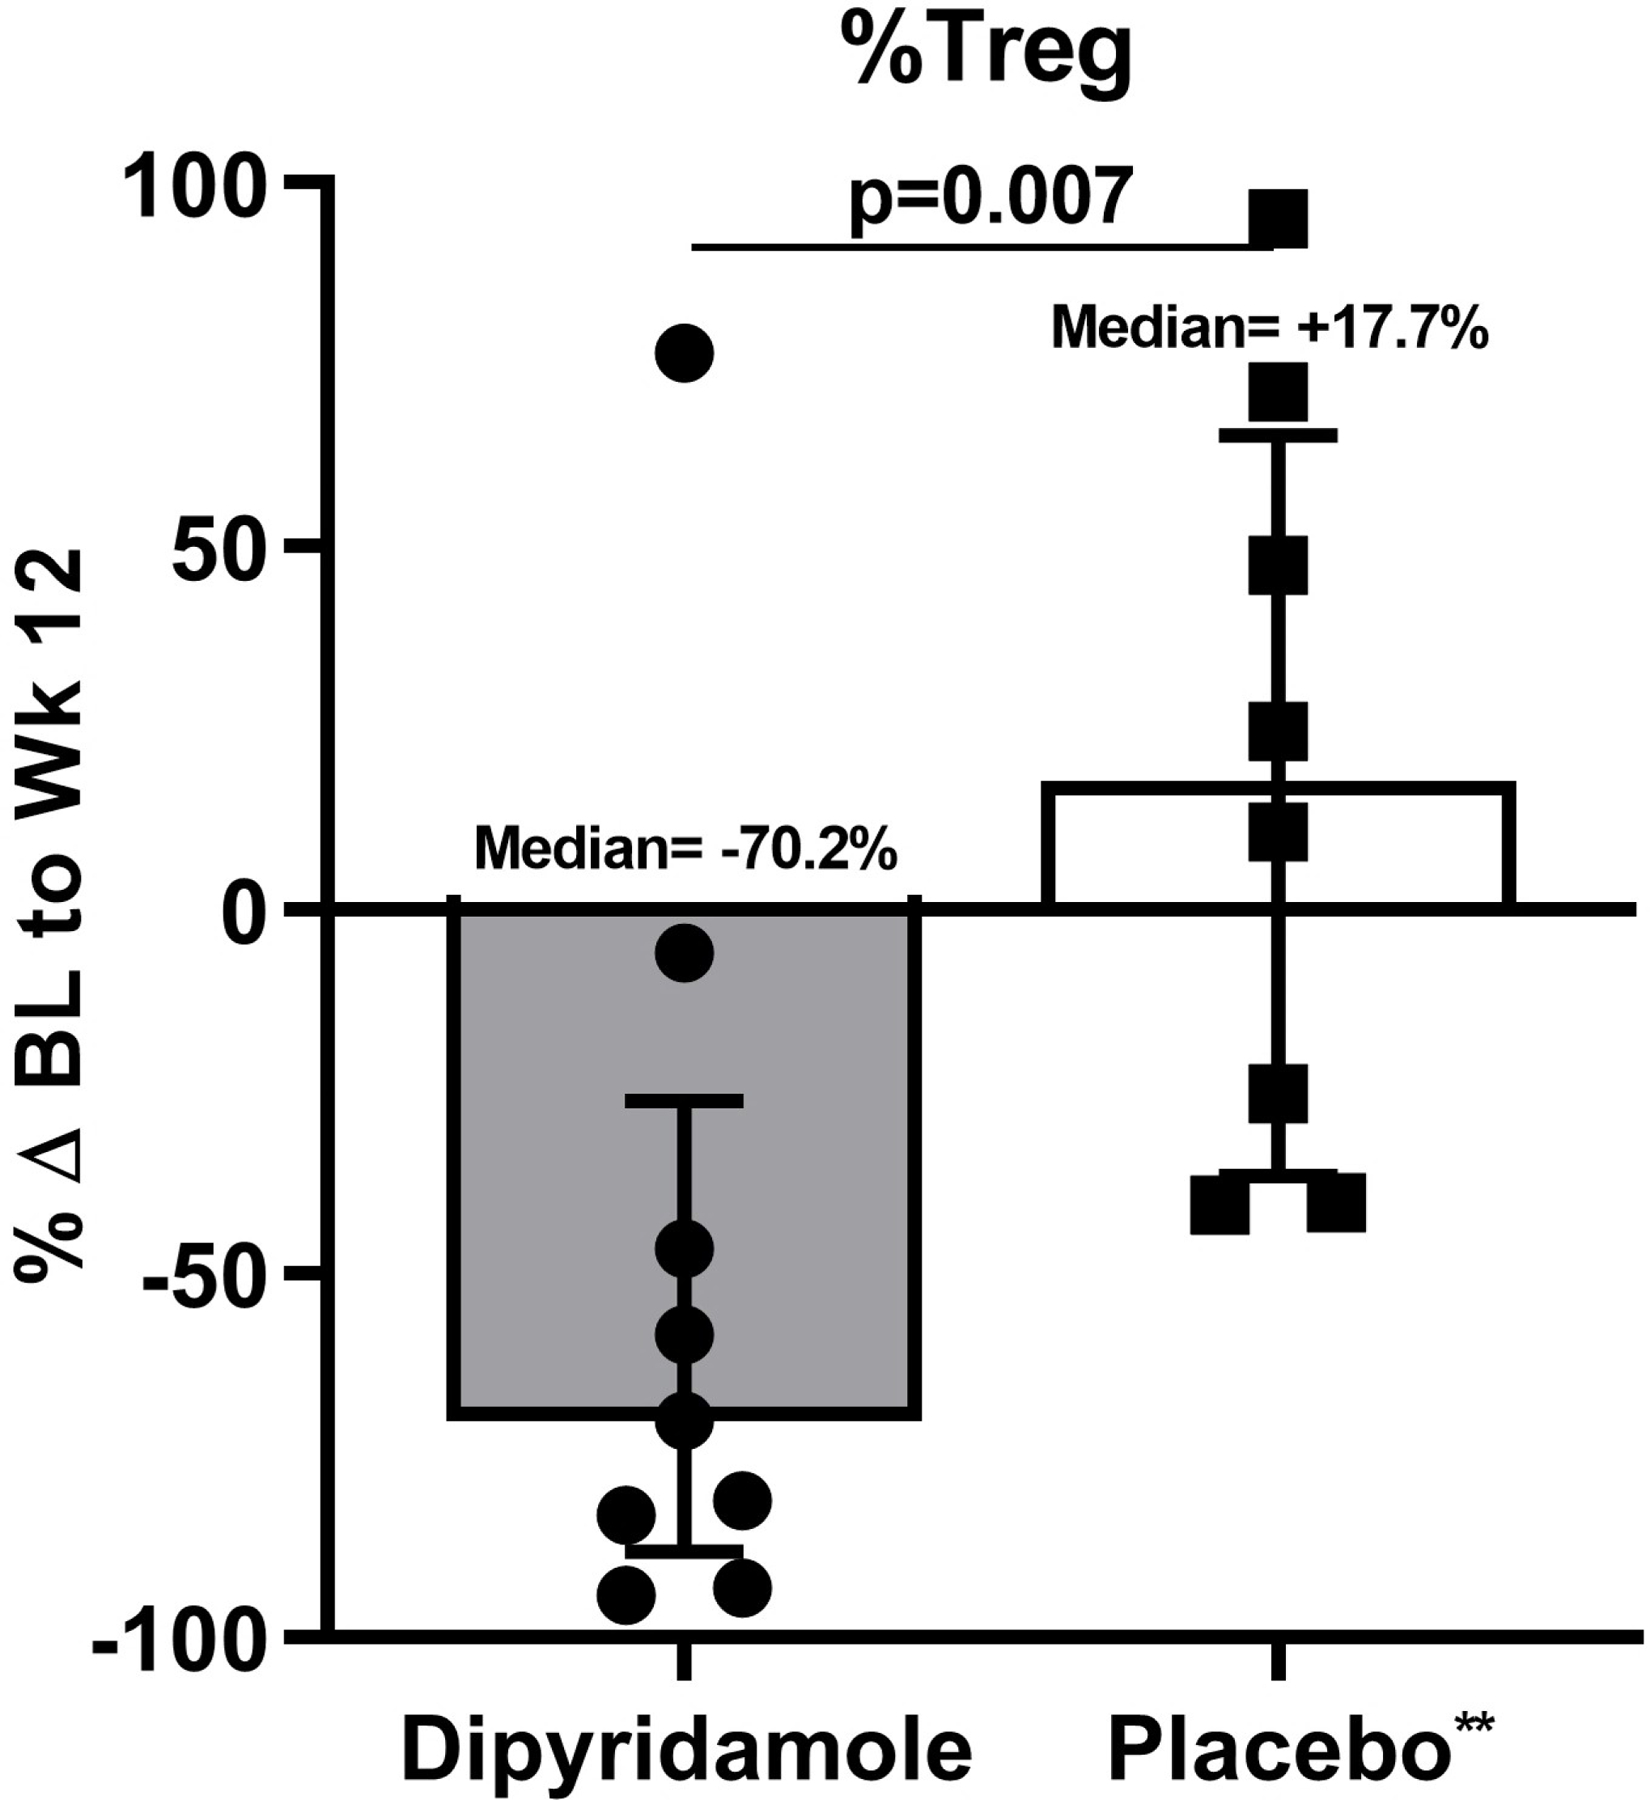
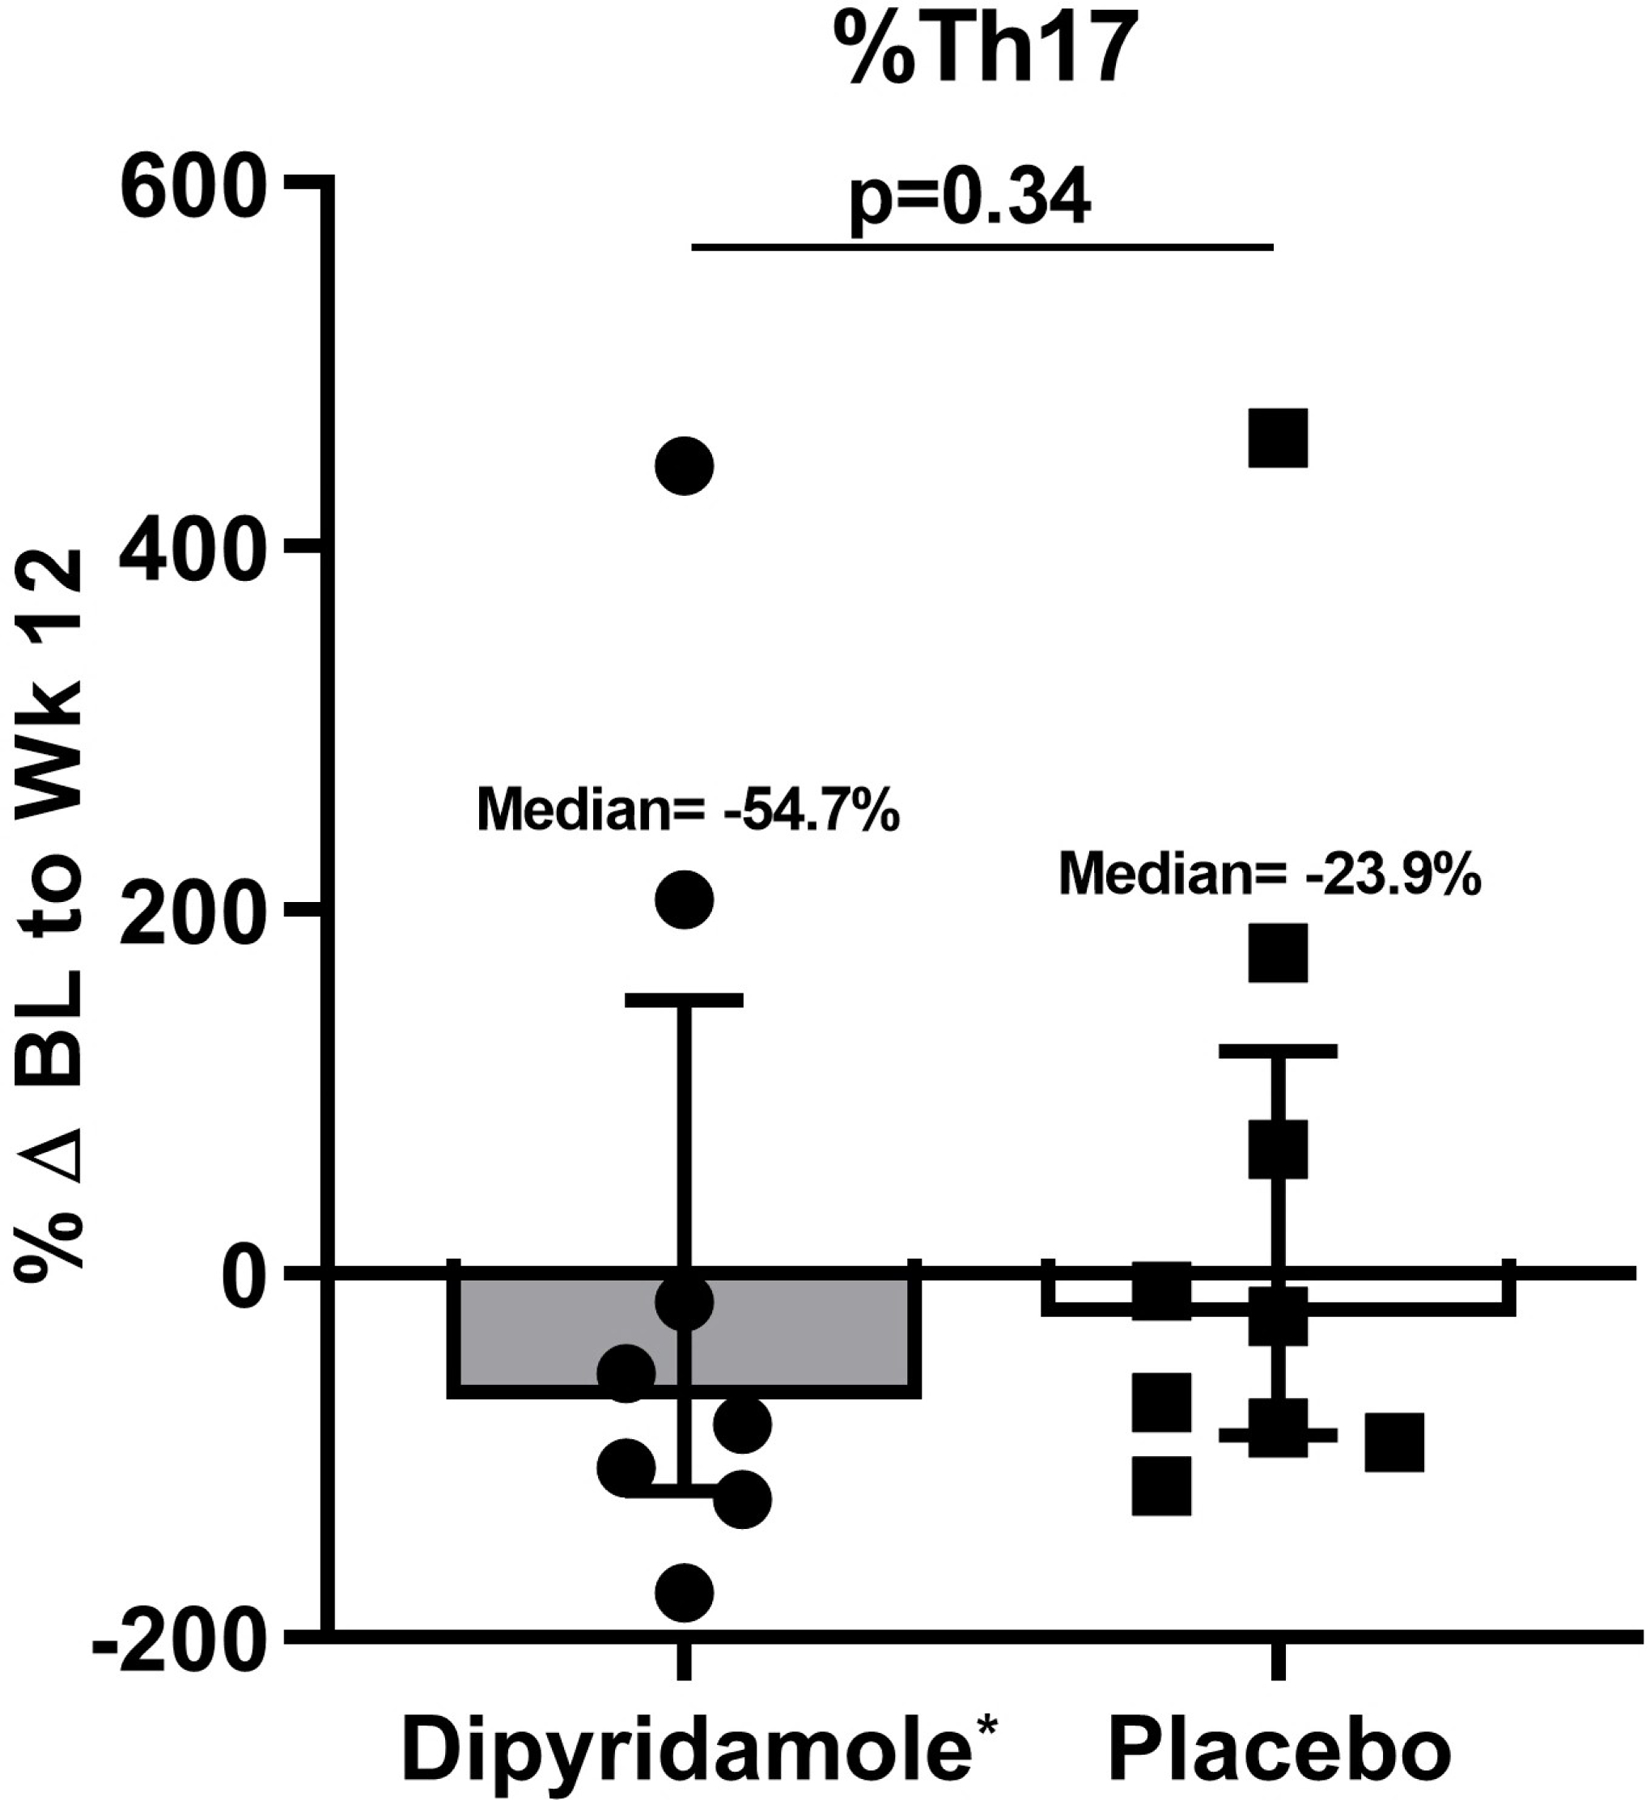
Figure 1.


Baseline (BL) to Week (Wk) 12 percent changes in the gut mucosal frequencies of (A) CD4+ T cells, (B) CD8+ T cells, (C) regulatory T cells (Treg; CD4+ CD25HI FOXP3+), and (D) Th17 cells (CD4+ IL17A+ T cells following stimulation). Graphs show median and interquartile range. *Outlier values in the dipyridamole arm (102.5% change in mucosal CD8+ T cell and 4255% change in gut Th17 cells) and an **outlier value in the placebo arm (1346.8% change in gut Treg) was excluded in the graphs but included in the statistical analyses.
