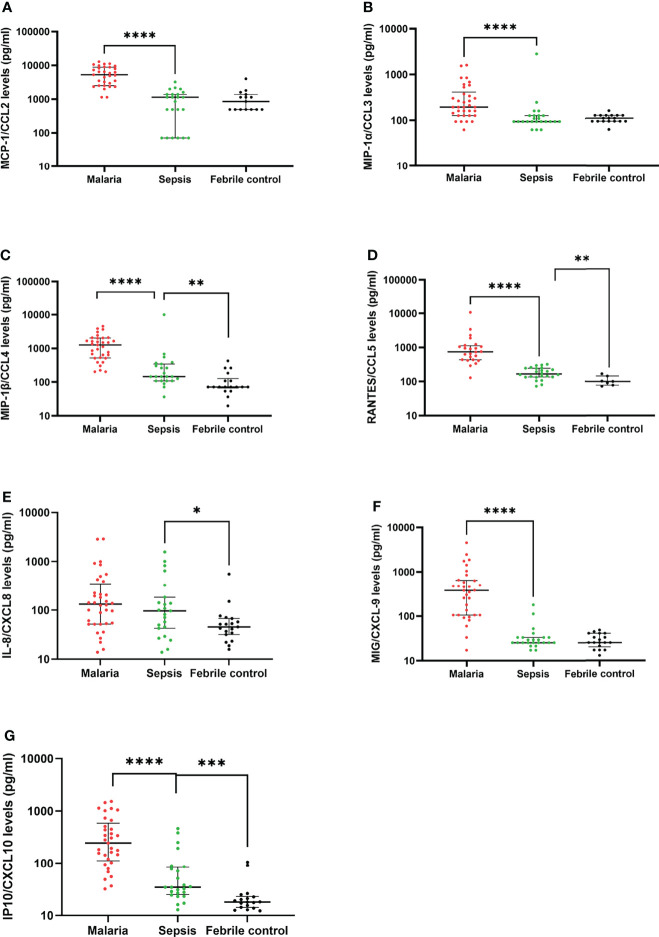
Figure 1.
Patterns of chemokine expression in children with sepsis compared to malaria and febrile controls. The scatter plots show the plasma levels of chemokines (pg/ml) (A-G) detected in children with clinical malaria, sepsis and febrile controls. The plots indicate the median and interquartile ranges. Differences were considered significant when p<0.05. Statistically significant values are denoted by *p < 0.05; **p < 0.01; ***p < 0.001; ****p < 0.0001. Statistical analyses were performed using the Kruskal-Wallis with Dunn’s Multiple comparison post-hoc test.

