
Figure 2.
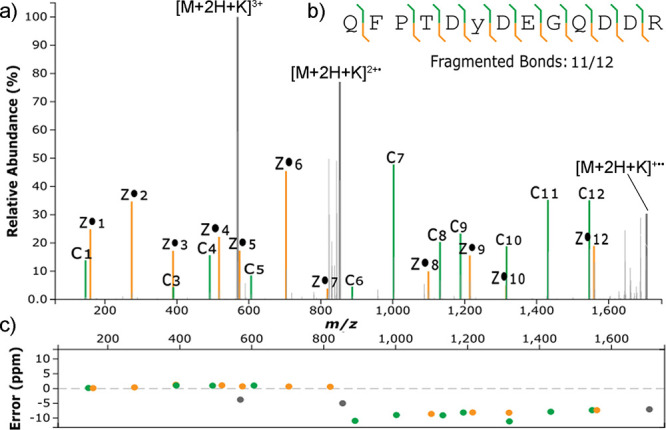
(a) Matched ETD spectrum of the +3 charged K+ adduct of QFPTDYDEGQDDR considering an SO3K modification (+117.9127) on Y6; (b) backbone fragmentation coverage; (c) ppm error of matched product ions. Colors are associated with the type of product ion: green for c-type, yellow for z-type, gray for precursors.